一、Linux监控
1. 监控的意义
- 事前预警
- 数据分析
2. 常用监控命令
CPU
- top
|
us CPU的用户态 sy CPU的内核态 ni CPU的优先级 id CPU的空闲时间 wa CPU的I/O等待 hi CPU的硬中断 si CPU的软中断 st CPU的虚拟化利用率 |
[root@zabbix-server ~]# top
top - 16:27:06 up  1:17,  1 user,  load average: 0.00, 0.01, 0.02
Tasks:  95 total,   1 running,  94 sleeping,   0 stopped,   0 zombie
%Cpu(s):  0.0 us,  0.3 sy,  0.0 ni, 99.7 id,  0.0 wa,  0.0 hi,  0.0 si,  0.0 st
KiB Mem :  2028088 total,  1812640 free,    96052 used,   119396 buff/cache
KiB Swap:  1048572 total,  1048572 free,        0 used.  1780604 avail Mem

   PID USER      PR  NI    VIRT    RES    SHR S %CPU %MEM     TIME+ COMMAND
     1 root      20   0   43652   4012   2548 S  0.0  0.2   0:01.50 systemd
     2 root      20   0       0      0      0 S  0.0  0.0   0:00.00 kthread
...- htop
[root@zabbix-server ~]# htop

  CPU[                                      0.0%]   Tasks: 22, 13 thr; 1 running
  Mem[||||||                          126M/1.93G]   Load average: 0.00 0.01 0.02
  Swp[                                  0K/1024M]   Uptime: 01:18:12

   PID USER      PRI  NI  VIRT   RES   SHR S CPU% MEM%   TIME+  Command
     1 root       20   0 43652  4012  2548 S  0.0  0.2  0:01.50 /usr/lib/systemd/systemd --switched-root
  2969 root   20   0 39076  2780  2468 S  0.0  0.1  0:00.10 /usr/lib/systemd/systemd-journald
  2997 root   20   0 44480  1888  1316 S  0.0  0.1  0:00.84 /usr/lib/systemd/systemd-udevd
  6765 root   16  -4 62044  1080   496 S  0.0  0.1  0:00.00 /sbin/auditd
  6766 root   16  -4 62044  1080   496 S  0.0  0.1  0:00.00 /sbin/auditd
  6787 root   20   0 99564  6112  4504 S  0.0  0.3  0:00.04 /usr/bin/VGAuthService -s
...- uptime
[root@zabbix-server ~]# uptime
16:28:22 up 1:18, 1 user, load average: 0.00, 0.01, 0.02- w
[root@zabbix-server ~]# w
 16:28:31 up  1:18,  1 user,  load average: 0.00, 0.01, 0.02
USER     TTY      FROM             LOGIN@   IDLE   JCPU   PCPU WHAT
root pts/0 10.0.0.1 16:06 7.00s 0.04s 0.00s w- vmstat
[root@zabbix-server ~]# vmstat
procs -----------memory---------- ---swap-- -----io---- -system-- ------cpu-----
 r  b   swpd   free   buff  cache   si   so    bi    bo   in   cs us sy id wa st
 3  0      0 1812104   2076 118096    0    0    20     2   37   93  0  0 100  0  0
内存
- free
[root@zabbix-server ~]# free -h
              total        used        free      shared  buff/cache   available
Mem:           1.9G         93M        1.7G        9.5M        117M        1.7G
Swap:          1.0G          0B        1.0G
磁盘
- df
[root@zabbix-server ~]# df -h
Filesystem      Size  Used Avail Use% Mounted on
/dev/sda3        99G  1.7G   98G   2% /
devtmpfs        980M     0  980M   0% /dev
tmpfs           991M     0  991M   0% /dev/shm
tmpfs           991M  9.5M  981M   1% /run
tmpfs           991M     0  991M   0% /sys/fs/cgroup
/dev/sda1       197M  105M   93M  54% /boot
tmpfs 199M 0 199M 0% /run/user/0- iotop
[root@zabbix-server ~]# iotop
Total DISK READ :   0.00 B/s | Total DISK WRITE :       0.00 B/s
Actual DISK READ:   0.00 B/s | Actual DISK WRITE:       0.00 B/s
   TID  PRIO  USER     DISK READ  DISK WRITE  SWAPIN     IO>    COMMAND
  7558 be/4 root        0.00 B/s    0.00 B/s  0.00 %  0.01 % [kworker/0:1]
     1 be/4 root        0.00 B/s    0.00 B/s  0.00 %  0.00 % systemd --switched-ro~stem --deserialize 22
     2 be/4 root        0.00 B/s    0.00 B/s  0.00 %  0.00 % [kthreadd]
     3 be/4 root        0.00 B/s    0.00 B/s  0.00 %  0.00 % [ksoftirqd/0]
...- iostat
| tps 硬盘每秒的传输次数 |
[root@zabbix-server ~]# iostat
Linux 3.10.0-957.el7.x86_64 (zabbix-server)     01/08/2020  _x86_64_    (1 CPU)

avg-cpu:  %user   %nice %system %iowait  %steal   %idle
           0.10    0.00    0.26    0.05    0.00   99.59

Device:            tps    kB_read/s    kB_wrtn/s    kB_read    kB_wrtn
scd0              0.00         0.21         0.00       1028          0
sda               1.44        19.49         2.10      94426      10184
网卡
- iftop
[root@zabbix-server ~]# iftop
interface: eth0
IP address is: 10.0.0.251
MAC address is: 00:0c:29:43:8e:c8
                    19.1Mb               38.1Mb               57.2Mb               76.3Mb     95.4Mb
└───────────────────┴────────────────────┴────────────────────┴────────────────────┴────────────────────
localhost                              => 101.6.8.193                            4.38Kb  4.31Kb  4.26Kb
                                       <=                                         750Kb   794Kb   797Kb
localhost                              => localhost                              6.83Kb  7.03Kb  7.86Kb
                                       <=                                        1.56Kb  1.47Kb  1.50Kb
localhost                              => localhost                                 0b      0b    157b
<= 0b 0b 197b- nethogs
[root@zabbix-server ~]# nethogs
Ethernet link detected
                      Ethernet link detected
                                            Waiting for first packet to arrive (see sourceforge.net bug 1019381)
NetHogs version 0.8.5

    PID USER     PROGRAM                                            DEV        SENT      RECEIVED
   7636 root     wget                                               eth0        0.527      85.388 KB/sec
   7512 root     sshd: root@pts/0                                   eth0        0.826       0.246 KB/sec
      ? root     unknown TCP                                                    0.000       0.000 KB/sec

  TOTAL                                                                         1.353      85.634 KB/sec
系统进程
- ps
[root@zabbix-server ~]# ps -ef | head
UID         PID   PPID  C STIME TTY          TIME CMD
root          1      0  0 15:09 ?        00:00:01 /usr/lib/systemd/systemd --switched-root --system --deserialize 22
root          2      0  0 15:09 ?        00:00:00 [kthreadd]
root          3      2  0 15:09 ?        00:00:00 [ksoftirqd/0]
root          5      2  0 15:09 ?        00:00:00 [kworker/0:0H]
root          7      2  0 15:09 ?        00:00:00 [migration/0]
root          8      2  0 15:09 ?        00:00:00 [rcu_bh]
root          9      2  0 15:09 ?        00:00:00 [rcu_sched]
root         10      2  0 15:09 ?        00:00:00 [lru-add-drain]
root 11 2 0 15:09 ? 00:00:00 [watchdog/0]- pstree
[root@zabbix-server ~]# pstree
systemd─┬─VGAuthService
        ├─abrt-watch-log
        ├─abrtd
        ├─agetty
        ├─auditd───{auditd}
        ├─crond
        ├─dbus-daemon
        ├─master─┬─pickup
        │        └─qmgr
        ├─polkitd───6*[{polkitd}]
        ├─rsyslogd───2*[{rsyslogd}]
        ├─sshd─┬─sshd───bash───pstree
        │      └─sshd───bash
        ├─systemd-journal
        ├─systemd-logind
        ├─systemd-udevd
        ├─tuned───4*[{tuned}]
        └─vmtoolsd
系统日志
建议使用ELK平台进行日志监控
- /var/log/message
- /var/log/secure
3. Shell脚本监控服务器
监控少量服务器时,可采用shell+crontab的方式实现服务器的简单监控。
#示例
[root@zabbix-server /server/scripts]# vim monitor_mem.sh
#!/bin/bash
avai_mem=`free -m | awk '/^Mem/ {print $NF}'`
if [ $avai_mem -lt 200 ];then
    echo "Available Memory is too low, Mem is $avai_mem" >>/tmp/monitor_mem.log
    echo "Available Memory is too low, Mem is $avai_mem" | mail -s "Avai Mem is Low" aspen_han@sina.com
fi
[root@zabbix-server /server/scripts]# cat /tmp/monitor_mem.log
Available Memory is too low, Mem is 109
4. 监控角度
| 监控层面 | 监控手段 | 监控项 |
|---|---|---|
| 服务器硬件 | ipmi芯片 | CPU温度、主板温度、整机功率、风扇转速、硬盘健康状态... |
| 操作系统 | Zabbix | CPU负载、内存使用率、硬盘、网卡流量、系统进程数量、相关文件 |
| 应用程序 | Zabbix | 根据应用选取相应的监控项 |
| 业务层面 | 访问速度、业务流量(pv/uv/ip)、状态... | |
| 网络设备 | Zabbix | SNMP |
| 相关日志 | ELK | 业务日志 |
二、Zabbix的安装部署
1. 基础服务架构

2. Zabbix部署流程
Zabbix安装前,需关闭SElinux
[root@zabbix-server /server/scripts]# getenforce
Disabled
step 1 下载Zabbix-release
| wget http://repo.zabbix.com/zabbix/4.0/rhel/7/x86_64/zabbix-release-*.rpm |
wget http://repo.zabbix.com/zabbix/4.0/rhel/7/x86_64/zabbix-release-4.0-2.el7.noarch.rpm
--2020-01-08 17:00:50--  http://repo.zabbix.com/zabbix/4.0/rhel/7/x86_64/zabbix-release-4.0-2.el7.noarch.rpm
Resolving repo.zabbix.com (repo.zabbix.com)... 162.243.159.138, 2604:a880:1:20::b82:1001
Connecting to repo.zabbix.com (repo.zabbix.com)|162.243.159.138|:80... connected.
HTTP request sent, awaiting response... 200 OK
Length: 13800 (13K) [application/x-redhat-package-manager]
Saving to: ‘zabbix-release-4.0-2.el7.noarch.rpm’

100%[==============================================================>] 13,800      --.-K/s   in 0.001s

2020-01-08 17:00:51 (23.6 MB/s) - ‘zabbix-release-4.0-2.el7.noarch.rpm’ saved [13800/13800]
step 2 安装Zabbix官方源
| yum localinstall -y zabbix-release-4.0-1.el7.noarch.rpm |
[root@zabbix-server /tmp]# yum localinstall -y zabbix-release-4.0-2.el7.noarch.rpm
Loaded plugins: fastestmirror
......
Installed:
  zabbix-release.noarch 0:4.0-2.el7

Complete!
step 3 将官方仓库地址替换为清华仓库地址
| sed -i 's#http://repo.zabbix.com#https://mirror.tuna.tsinghua.edu.cn/zabbix#g' /etc/yum.repos.d/zabbix.repo |
[root@zabbix-server /tmp]# sed -i 's#http://repo.zabbix.com#https://mirror.tuna.tsinghua.edu.cn/zabbix#g' /etc/yum.repos.d/zabbix.repostep 4 安装Zabbix服务端和Zabbix-Web端
| yum install -y zabbix-server-mysql zabbix-web-mysql |
[root@zabbix-server /tmp]# yum install -y zabbix-server-mysql zabbix-web-mysql
Loaded plugins: fastestmirror
Loading mirror speeds from cached hostfile
...
  unixODBC.x86_64 0:2.3.1-14.el7                    zabbix-web.noarch 0:4.0.16-1.el7
Complete!
step 5 安装并启动数据库
本文以MariaDB为例
|
yum install -y mariadb-server systemctl start mariadb-server mysql_secure_installation #MariaDB安全初始化(可选操作) |
[root@zabbix-server /tmp]# yum install -y mariadb-server.x86_64
Loaded plugins: fastestmirror
Loading mirror speeds from cached hostfile
...
Dependency Updated:
  mariadb-libs.x86_64 1:5.5.64-1.el7

Complete!
[root@zabbix-server /tmp]# systemctl start mariadb.service
[root@zabbix-server /tmp]# mysql_secure_installation
Enter current password for root (enter for none):
OK, successfully used password, moving on...

Setting the root password ensures that nobody can log into the MariaDB
root user without the proper authorisation.

Set root password? [Y/n] n
 ... skipping.
...
Remove anonymous users? [Y/n] y
 ... Success!
...
Disallow root login remotely? [Y/n] y
 ... Success!
...
Remove test database and access to it? [Y/n] y
 - Dropping test database...
 ... Success!
 - Removing privileges on test database...
 ... Success!
...
Reload privilege tables now? [Y/n] y
 ... Success!
...
Thanks for using MariaDB!
step 6 创建zabbix数据库及账户
|
create database 数据库名称 character set utf8 collate utf8_bin; grant all privileges on 数据库名称.* to 用户名@授权主机 identified by '密码'; |
MariaDB [(none)]> create database zabbix character set utf8 collate utf8_bin;
Query OK, 1 row affected (0.00 sec)
MariaDB [(none)]> grant all privileges on zabbix.* to 'zabbix'@'localhost' identified by '123456';
Query OK, 0 rows affected (0.00 sec)
step 7 导入Zabbix表结构及初始数据
| zcat /usr/share/doc/zabbix-server-mysql*/create.sql.gz | mysql -u用户名 -p密码 数据库名称 |
[root@zabbix-server /tmp]# zcat /usr/share/doc/zabbix-server-mysql-4.0.16/create.sql.gz |mysql -u root zabbix
[root@zabbix-server /tmp]# mysql -uroot zabbix -e "show tables;"
+----------------------------+
| Tables_in_zabbix           |
+----------------------------+
| acknowledges               |
| actions                    |
| alerts                     |
| application_discovery      |
| application_prototype      |
| application_template       |
| applications               |
| auditlog                   |
......
step 8 配置zabbix-server
|
# /etc/zabbix/zabbix_server.conf DBHost=IP地址 #指定数据库用户登录授权主机地址 DBName=数据库名称 #指定连接数据库名称 DBUser=数据库用户 #指定连接数据库用户名 DBPassword=数据库密码 #指定连接数据库密码 |
[root@zabbix-server ~]# grep -Ev "^$|#" /etc/zabbix/zabbix_server.conf| grep DB
DBHost=localhost
DBName=zabbix
DBUser=zabbix
DBPassword=123456| 后期修改zabbix数据库密码的时候,需要修改配置文件:/etc/zabbix/web/zabbix.conf.php |
[root@zabbix-server ~]# grep -Ev '#|^$' /etc/zabbix/web/zabbix.conf.php
<?php
// Zabbix GUI configuration file.
global $DB;
$DB['TYPE']     = 'MYSQL';
$DB['SERVER']   = 'localhost';
$DB['PORT']     = '0';
$DB['DATABASE'] = 'zabbix';
$DB['USER']     = 'zabbix';
$DB['PASSWORD'] = '123456';
// Schema name. Used for IBM DB2 and PostgreSQL.
$DB['SCHEMA'] = '';
$ZBX_SERVER      = 'localhost';
$ZBX_SERVER_PORT = '10051';
$ZBX_SERVER_NAME = 'Aspen_Han监控中心';
$IMAGE_FORMAT_DEFAULT = IMAGE_FORMAT_PNG;
step 9 启动zabbix-server
本文以MariaDB为例
| systemctl start zabbix-server |
[root@zabbix-server ~]# systemctl start zabbix-server.service
[root@zabbix-server ~]# netstat -lntup | grep 10051
tcp        0      0 0.0.0.0:10051           0.0.0.0:*               LISTEN      10115/zabbix_server
tcp6       0      0 :::10051                :::*                    LISTEN      10115/zabbix_server
step 10 配置并启动httpd服务
本文以MariaDB为例
|
# /etc/httpd/conf.d/zabbix.conf php_value data.timezone Asia/Shanghai systemctl start httpd |
[root@zabbix-server ~]# grep 'timezone' /etc/httpd/conf.d/zabbix.conf
        php_value date.timezone Asia/Shanghai
[root@zabbix-server ~]# systemctl start httpd.service
[root@zabbix-server ~]# netstat -lntup | grep httpd
tcp6       0      0 :::80                   :::*                    LISTEN      10309/httpd
step 11 Zabbix-Web的安装
|
初始登录密码 登录账户: Admin 登录密码: zabbix |

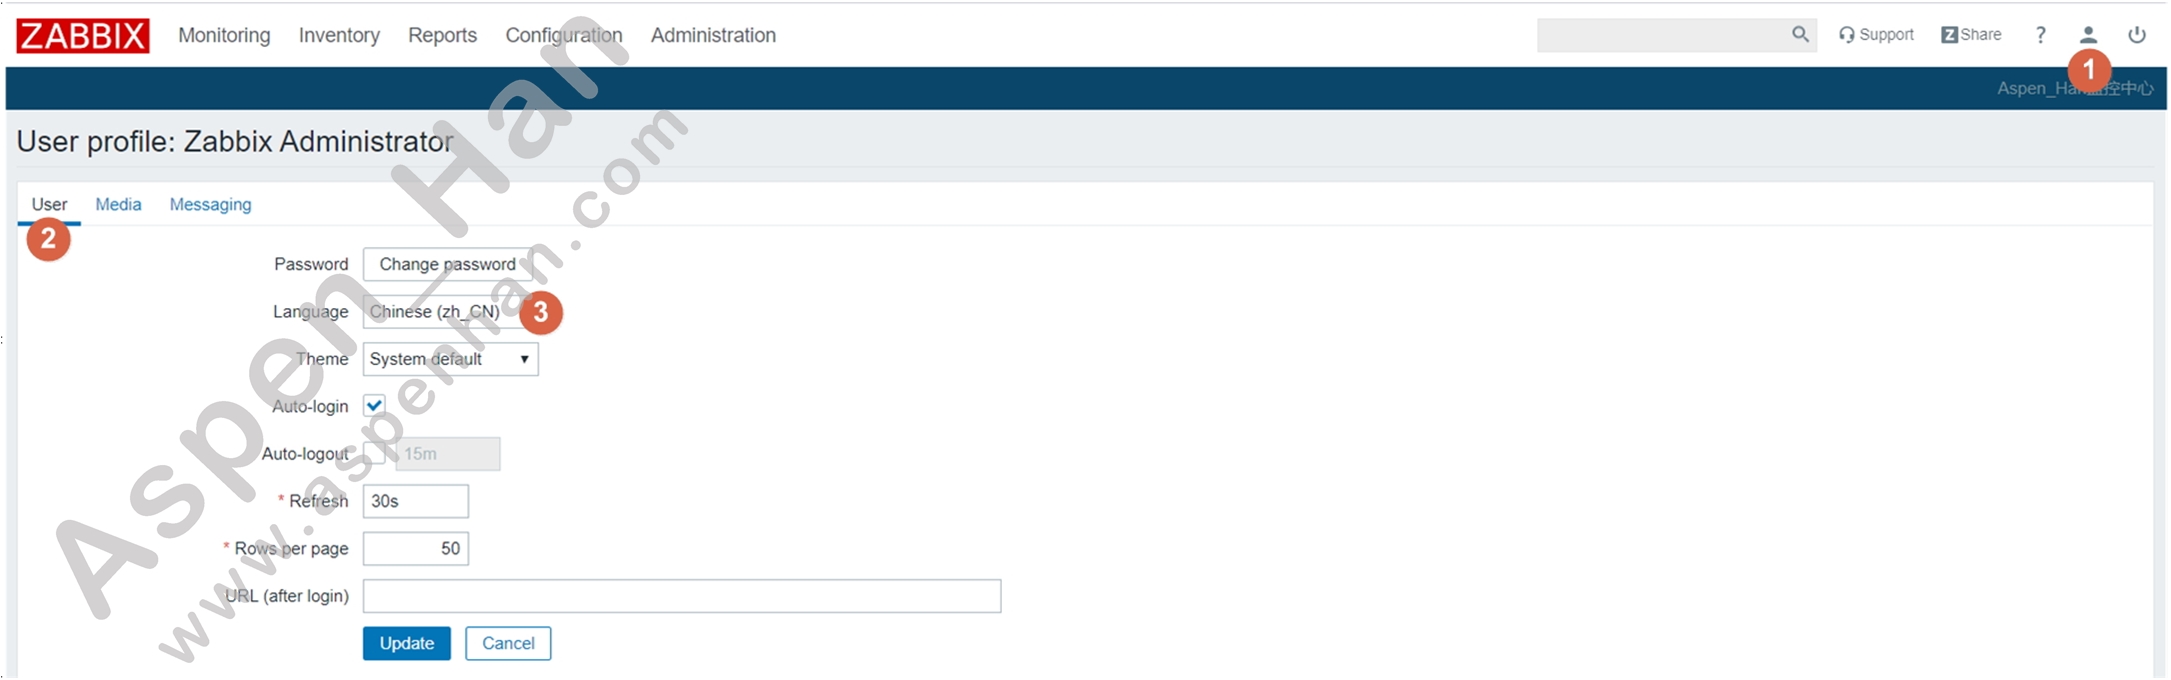
step 12 Zabbix-Web汉化
| User Profile -> User -> Language |
step 13 Zabbix-Web字符集字体优化
|
\mv 字体 /usr/share/zabbix/assets/fonts/graphfont.ttf 仅支持ttf格式的字体 |
[root@zabbix-server ~]# cd /usr/share/zabbix/assets/fonts/
[root@zabbix-server /usr/share/zabbix/assets/fonts]# ll
total 0
lrwxrwxrwx 1 root root 33 Jan  8 17:08 graphfont.ttf -> /etc/alternatives/zabbix-web-font
[root@zabbix-server /usr/share/zabbix/assets/fonts]# rz -E
rz waiting to receive.
[root@zabbix-server /usr/share/zabbix/assets/fonts]# \mv STZHONGS.TTF graphfont.ttf
[root@zabbix-server /usr/share/zabbix/assets/fonts]# ll
total 11852
-rw-r--r-- 1 root root 12135284 Jan 21  2014 graphfont.ttf
step 14 安装并启动Zabbix-Agent
Zabbix Server自带一个监控项,监控其本身。
|
yum install -y zabbix-agent systemctl start zabbix-agent |
[root@zabbix-server ~]# yum install -y zabbix-agent.x86_64
Loaded plugins: fastestmirror
Loading mirror speeds from cached hostfile
...
Installed:
  zabbix-agent.x86_64 0:4.0.16-1.el7

Complete!
[root@zabbix-server ~]# systemctl start zabbix-agent.service
[root@zabbix-server ~]# netstat -lntup | grep 10050
tcp        0      0 0.0.0.0:10050           0.0.0.0:*               LISTEN      11791/zabbix_agentd
tcp6       0      0 :::10050                :::*                    LISTEN      11791/zabbix_agentd
3. 添加监控主机
- 业务端
| Zabbix-Agent和Zabbix-Server版本应尽量统一 |
step 1 下载Zabbix-Agent安装包
| wget https://mirrors.tuna.tsinghua.edu.cn/zabbix/zabbix/4.0/rhel/7/x86_64/zabbix-agent-*.el7.x86_64.rpm |
[root@zabbix-web /tmp]# wget https://mirrors.tuna.tsinghua.edu.cn/zabbix/zabbix/4.0/rhel/7/x86_64/zabbix-agent-4.0.9-3.el7.x86_64.rpm
--2020-01-09 10:17:44--  https://mirrors.tuna.tsinghua.edu.cn/zabbix/zabbix/4.0/rhel/7/x86_64/zabbix-agent-4.0.9-3.el7.x86_64.rpm
Resolving mirrors.tuna.tsinghua.edu.cn (mirrors.tuna.tsinghua.edu.cn)... 101.6.8.193, 2402:f000:1:408:8100::1
Connecting to mirrors.tuna.tsinghua.edu.cn (mirrors.tuna.tsinghua.edu.cn)|101.6.8.193|:443... connected.
HTTP request sent, awaiting response... 200 OK
Length: 407448 (398K) [application/x-redhat-package-manager]
Saving to: ‘zabbix-agent-4.0.9-3.el7.x86_64.rpm’

100%[==============================================================>] 407,448     --.-K/s   in 0.07s

2020-01-09 10:17:44 (5.44 MB/s) - ‘zabbix-agent-4.0.9-3.el7.x86_64.rpm’ saved [407448/407448]
step 2 安装Zabbix-Agent
| yum localinstall -y zabbix-agent |
[root@zabbix-web /tmp]# yum localinstall -y zabbix-agent-4.0.9-3.el7.x86_64.rpm
Loaded plugins: fastestmirror
Examining zabbix-agent-4.0.9-3.el7.x86_64.rpm: zabbix-agent-4.0.9-3.el7.x86_64
...
Installed:
  zabbix-agent.x86_64 0:4.0.9-3.el7
Complete!
step 3 配置Zabbix-Agent
|
# /etc/zabbix/zabbix_agentd.conf Server=IP地址 #指定Zabbix-Server的IP地址 |
[root@zabbix-web /tmp]# grep -Ev '#|^$' /etc/zabbix/zabbix_agentd.conf| grep 'Server'
Server=10.0.0.251
ServerActive=127.0.0.1
step 4 启动Zabbix-Agent
| systemctl start zabbix-agent |
[root@zabbix-web /tmp]# systemctl start zabbix-agent.service
[root@zabbix-web /tmp]# netstat -lntup | grep 10050
tcp        0      0 0.0.0.0:10050           0.0.0.0:*               LISTEN      8658/zabbix_agentd
tcp6 0 0 :::10050 :::* LISTEN 8658/zabbix_agentd - Zabbix-Server端
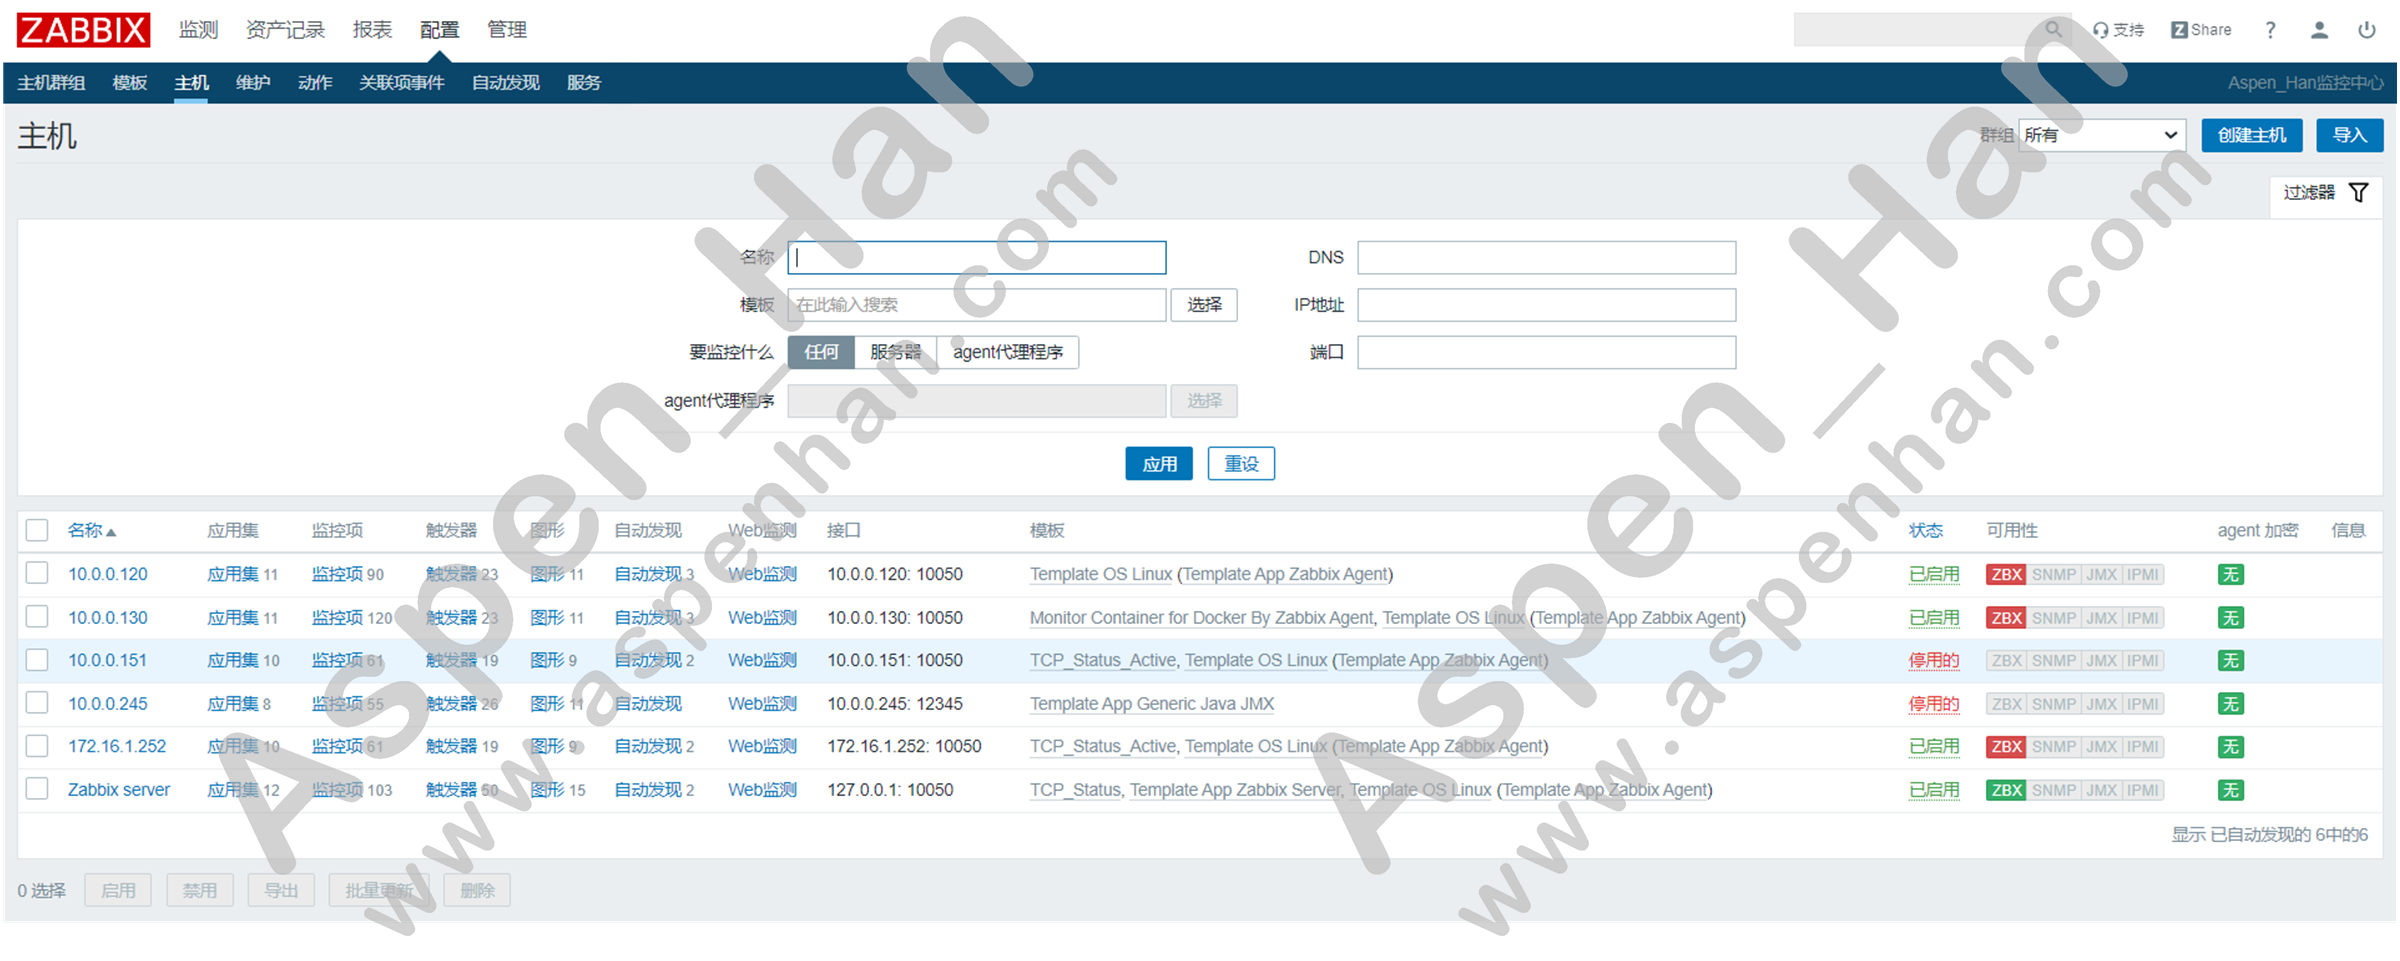
step 1 添加监控主机
| 配置 -> 主机 -> 创建主机 -> 主机 |
|
被监控主机名称必须唯一,不可重复 同一被监控主机可隶属于多个不同组 |

step 2 关联监控模版
step 3 确认监控状态
4. 基于Granafa的图形展示
|
主要内容 插件:zabbix插件 数据源:zabbix数据源 Dashboard |
step 1 安装Grafana
| yum localinstall -y 安装包 |
[root@zabbix-server ~]# wget https://mirrors.tuna.tsinghua.edu.cn/grafana/yum/rpm/grafana-6.5.2-1.x86_64.rpm
...
Saving to: ‘grafana-6.5.2-1.x86_64.rpm’

100%[==============================================================>] 60,813,768  7.66MB/s   in 8.2s

2020-01-09 10:56:05 (7.09 MB/s) - ‘grafana-6.5.2-1.x86_64.rpm’ saved [60813768/60813768]
[root@zabbix-server ~]# ls
anaconda-ks.cfg  grafana-6.5.2-1.x86_64.rpm
[root@zabbix-server ~]# yum localinstall -y grafana-6.5.2-1.x86_64.rpm
...

  xorg-x11-server-utils.x86_64 0:7.7-20.el7
Complete!
step 2 启动Grafana
Grafana启动默认使用3000端口
| systemctl start grafana-server |
[root@zabbix-server ~]# netstat -lntup| grep 3000
tcp6       0      0 :::3000                 :::*                    LISTEN      13352/grafana-serve
step 3 安装Zabbix插件
| grafana-cli plugins install alexanderzobnin-zabbix-app |
[root@zabbix-server ~]# grafana-cli plugins list-remote | grep zabbix
id: alexanderzobnin-zabbix-app version: 3.10.5
[root@zabbix-server ~]# grafana-cli plugins install alexanderzobnin-zabbix-app
installing alexanderzobnin-zabbix-app @ 3.10.5
from: https://grafana.com/api/plugins/alexanderzobnin-zabbix-app/versions/3.10.5/download
into: /var/lib/grafana/plugins

✔ Installed alexanderzobnin-zabbix-app successfully

Restart grafana after installing plugins . <service grafana-server restart>
step 4 重启Grafana
| service granafa-server restart |
[root@zabbix-server ~]# service grafana-server restart
Restarting grafana-server (via systemctl):                 [  OK  ]
step 5 登录Grafana
|
初始登录密码 登录账户: admin 登录密码: admin |

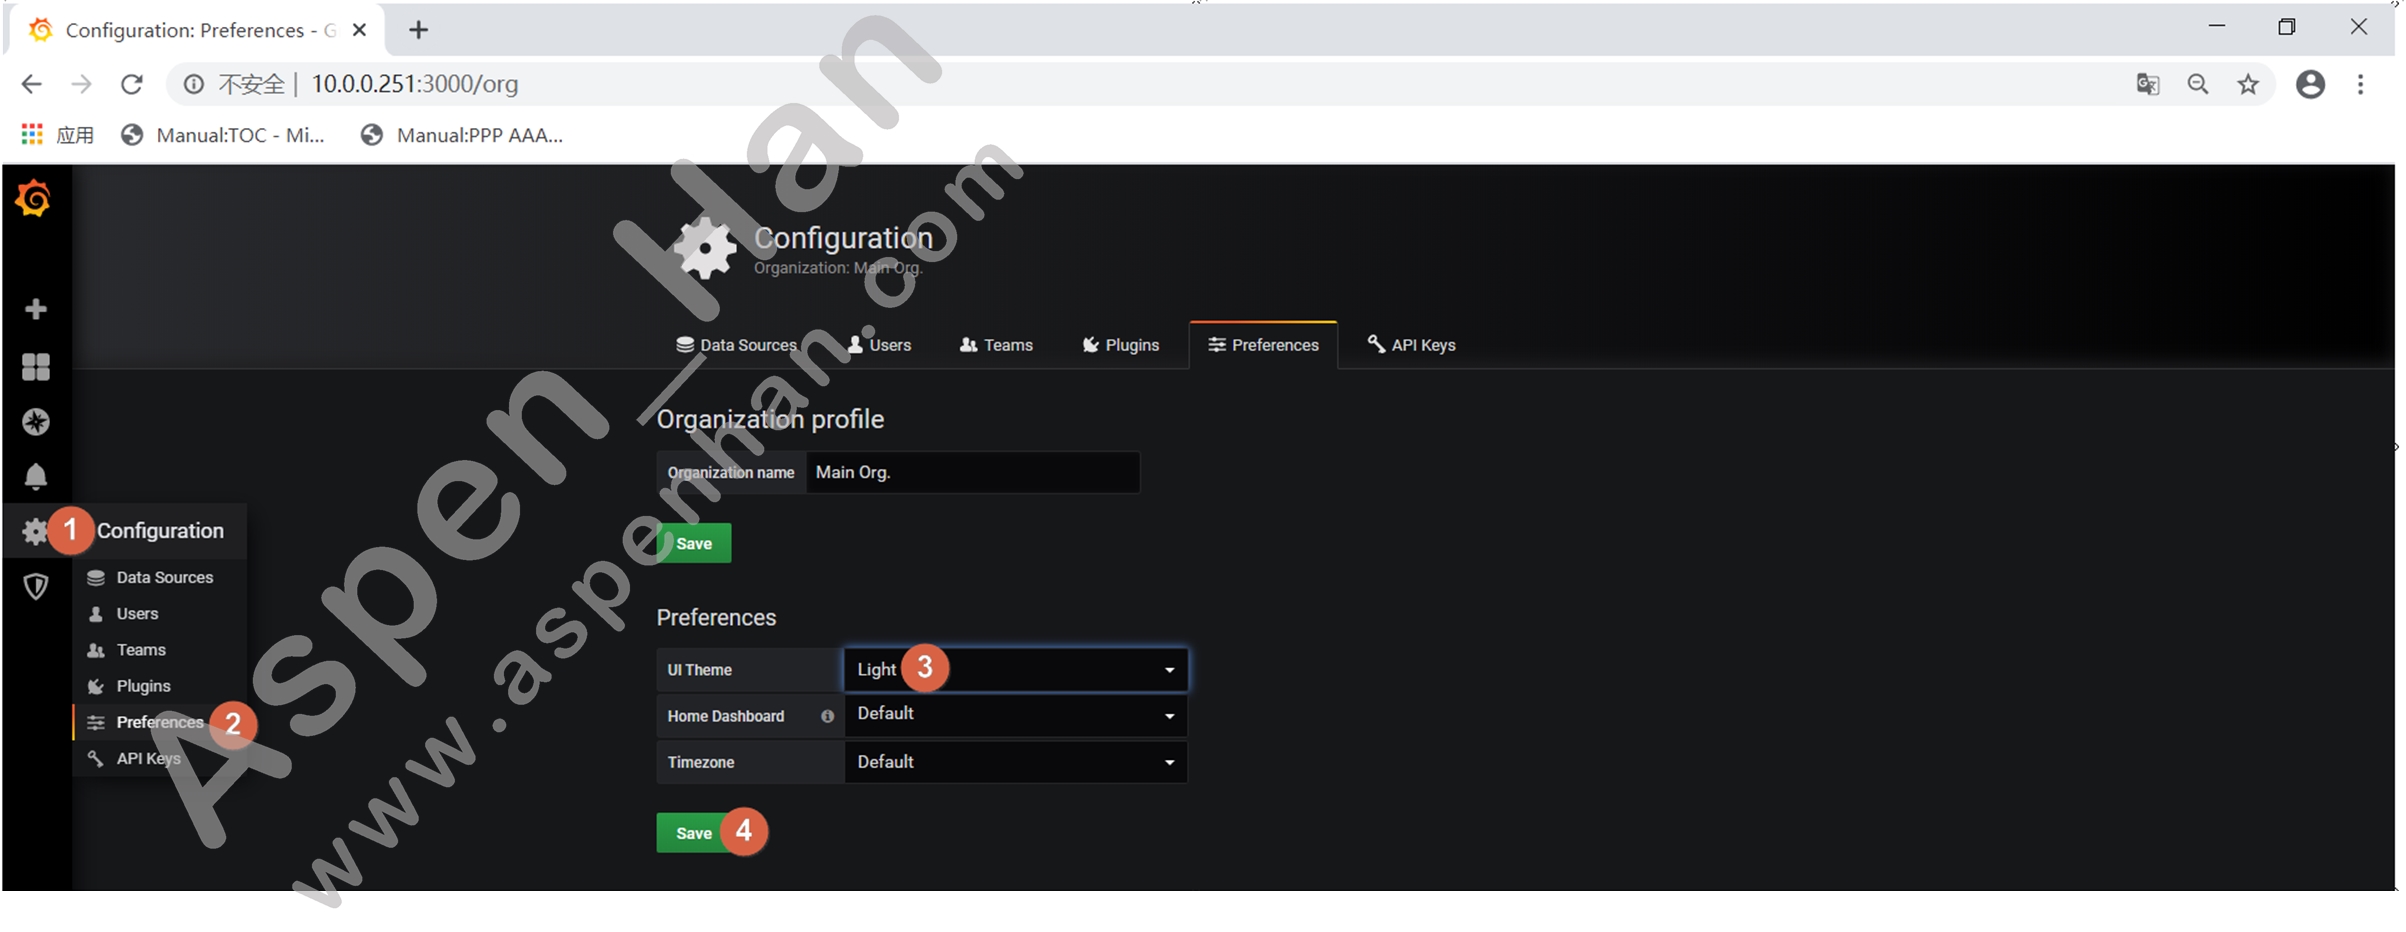
step 6 启用zabbix插件
| Configuration -> Plugins -> Zabbix -> config |

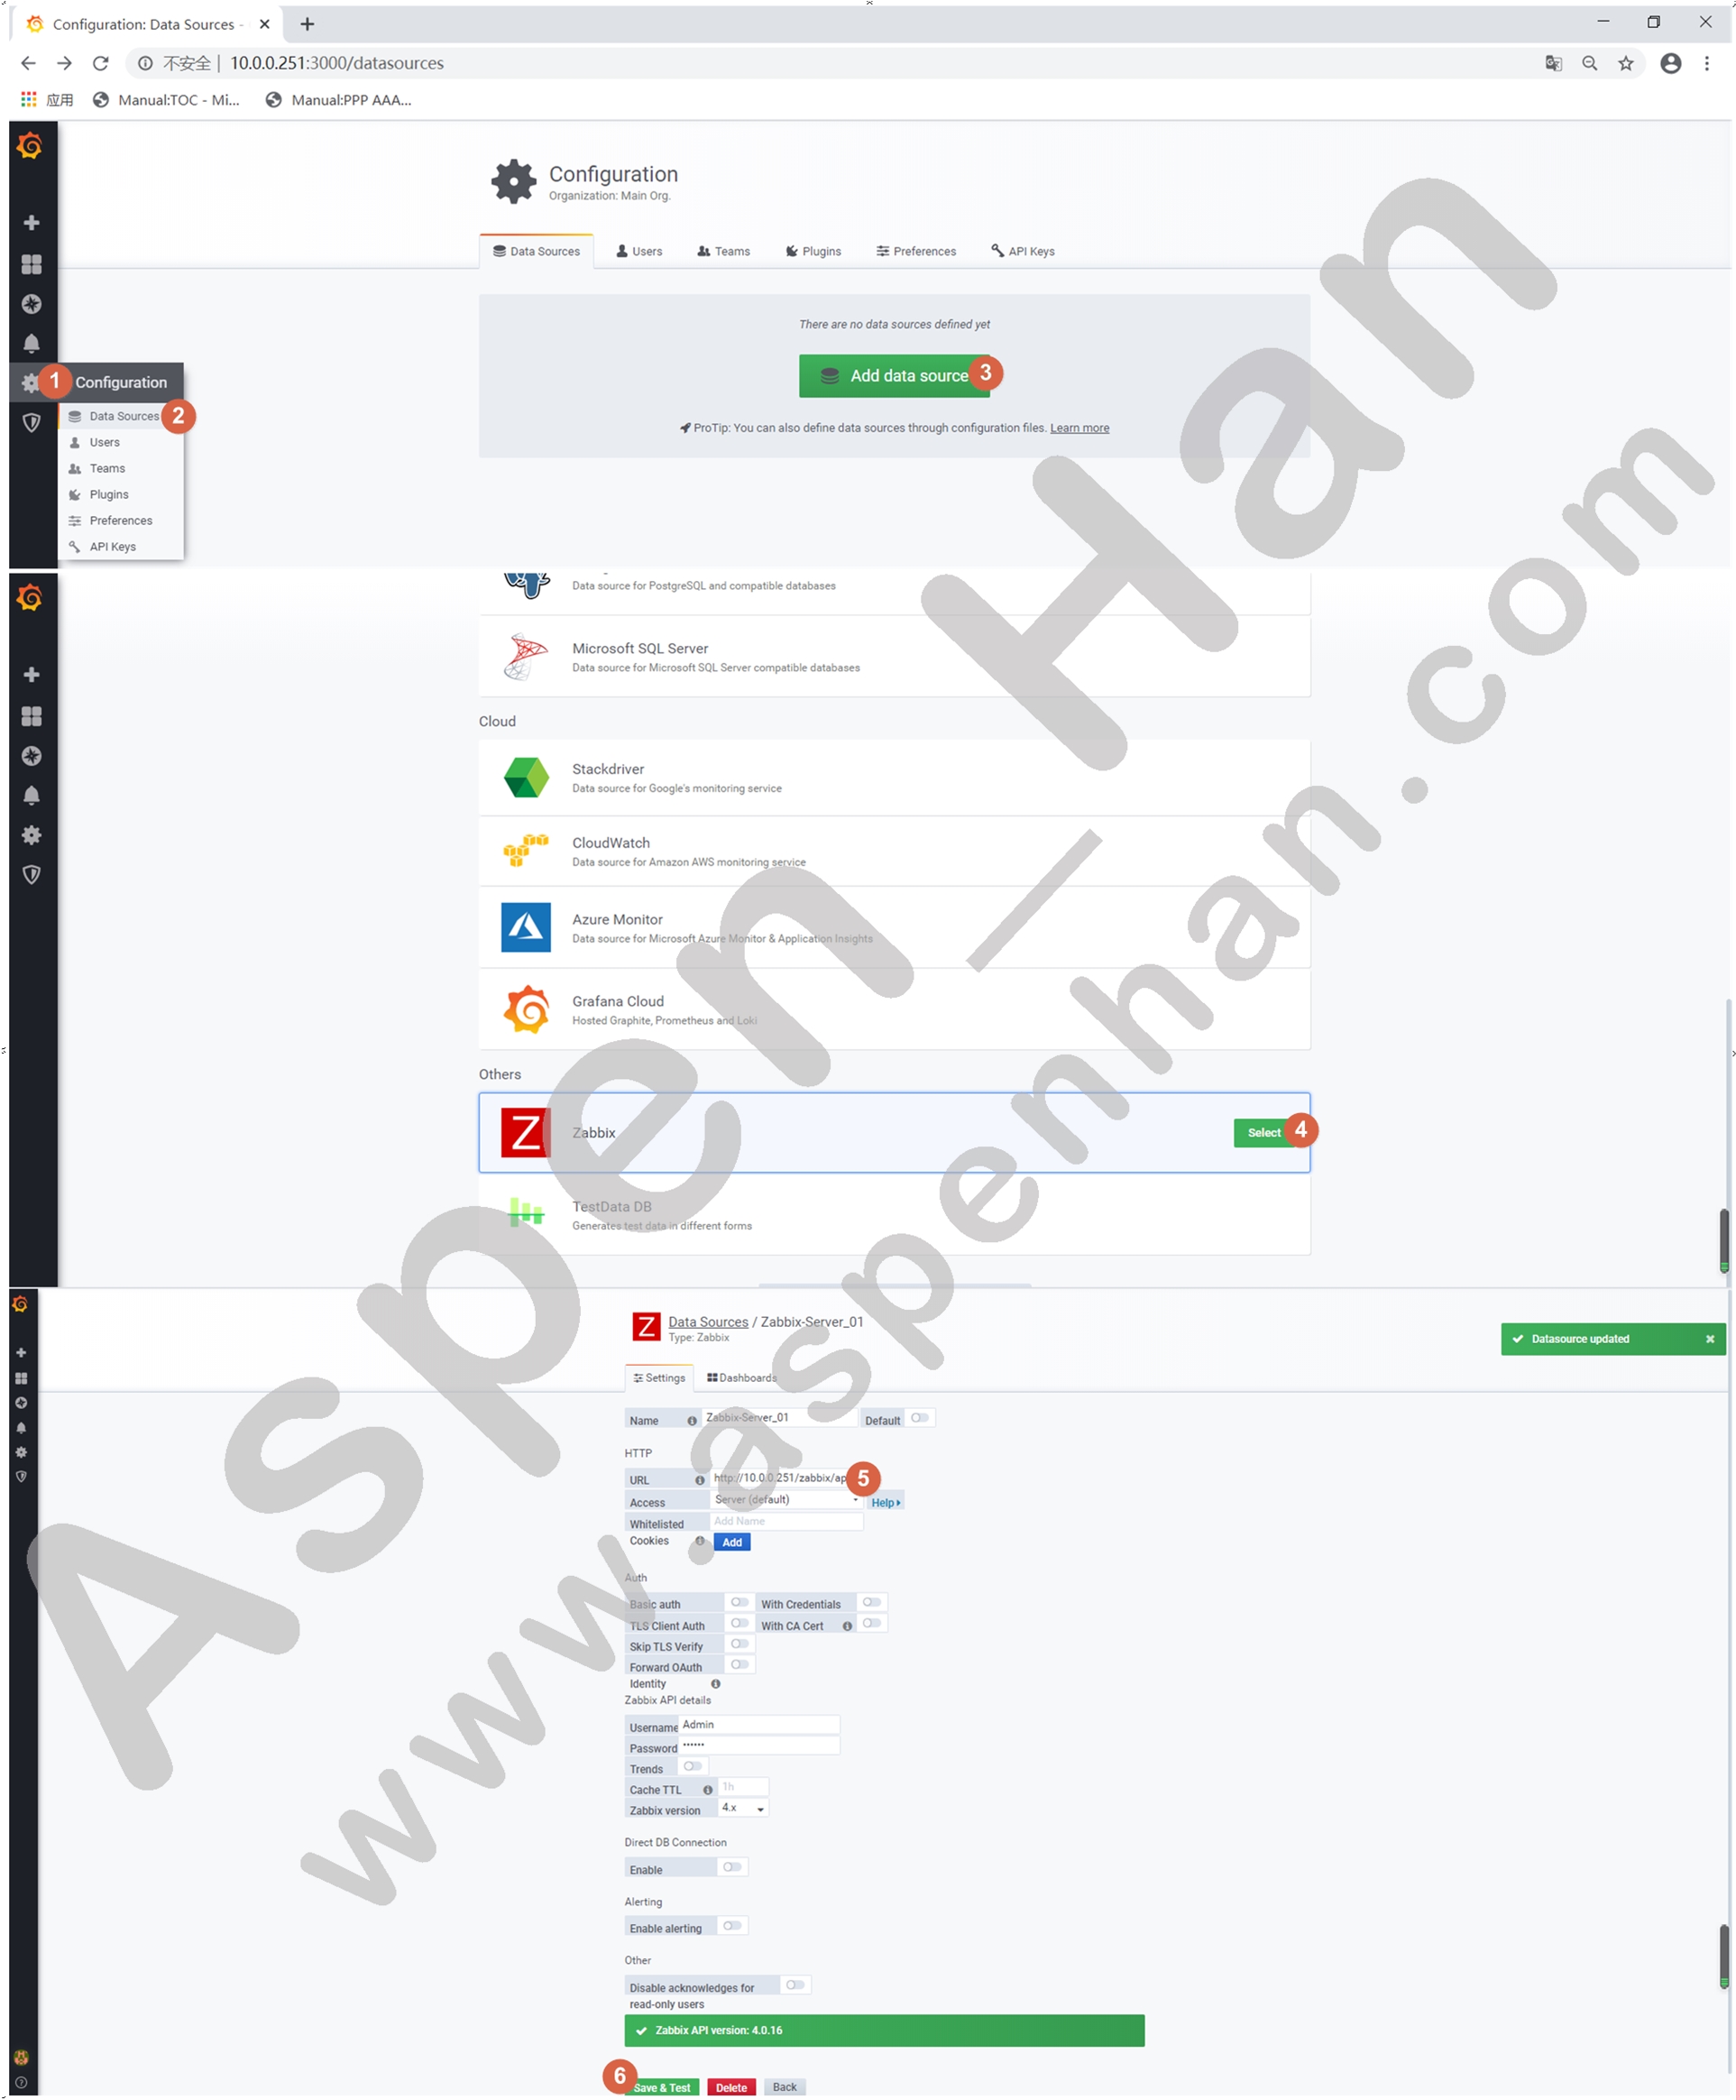
step 7 添加数据源
|
Configuration -> Data Sources -> Add data source -> Zabbix -> Settings Zabbix数据源地址:http://IP地址/zabbix/api_jsonrpc.php |
step 8 导入模版
| Configuration -> Data Sources -> Add data source -> Zabbix -> Dashboards |

step 9 模版展示
| Dashboards -> Home -> Home |

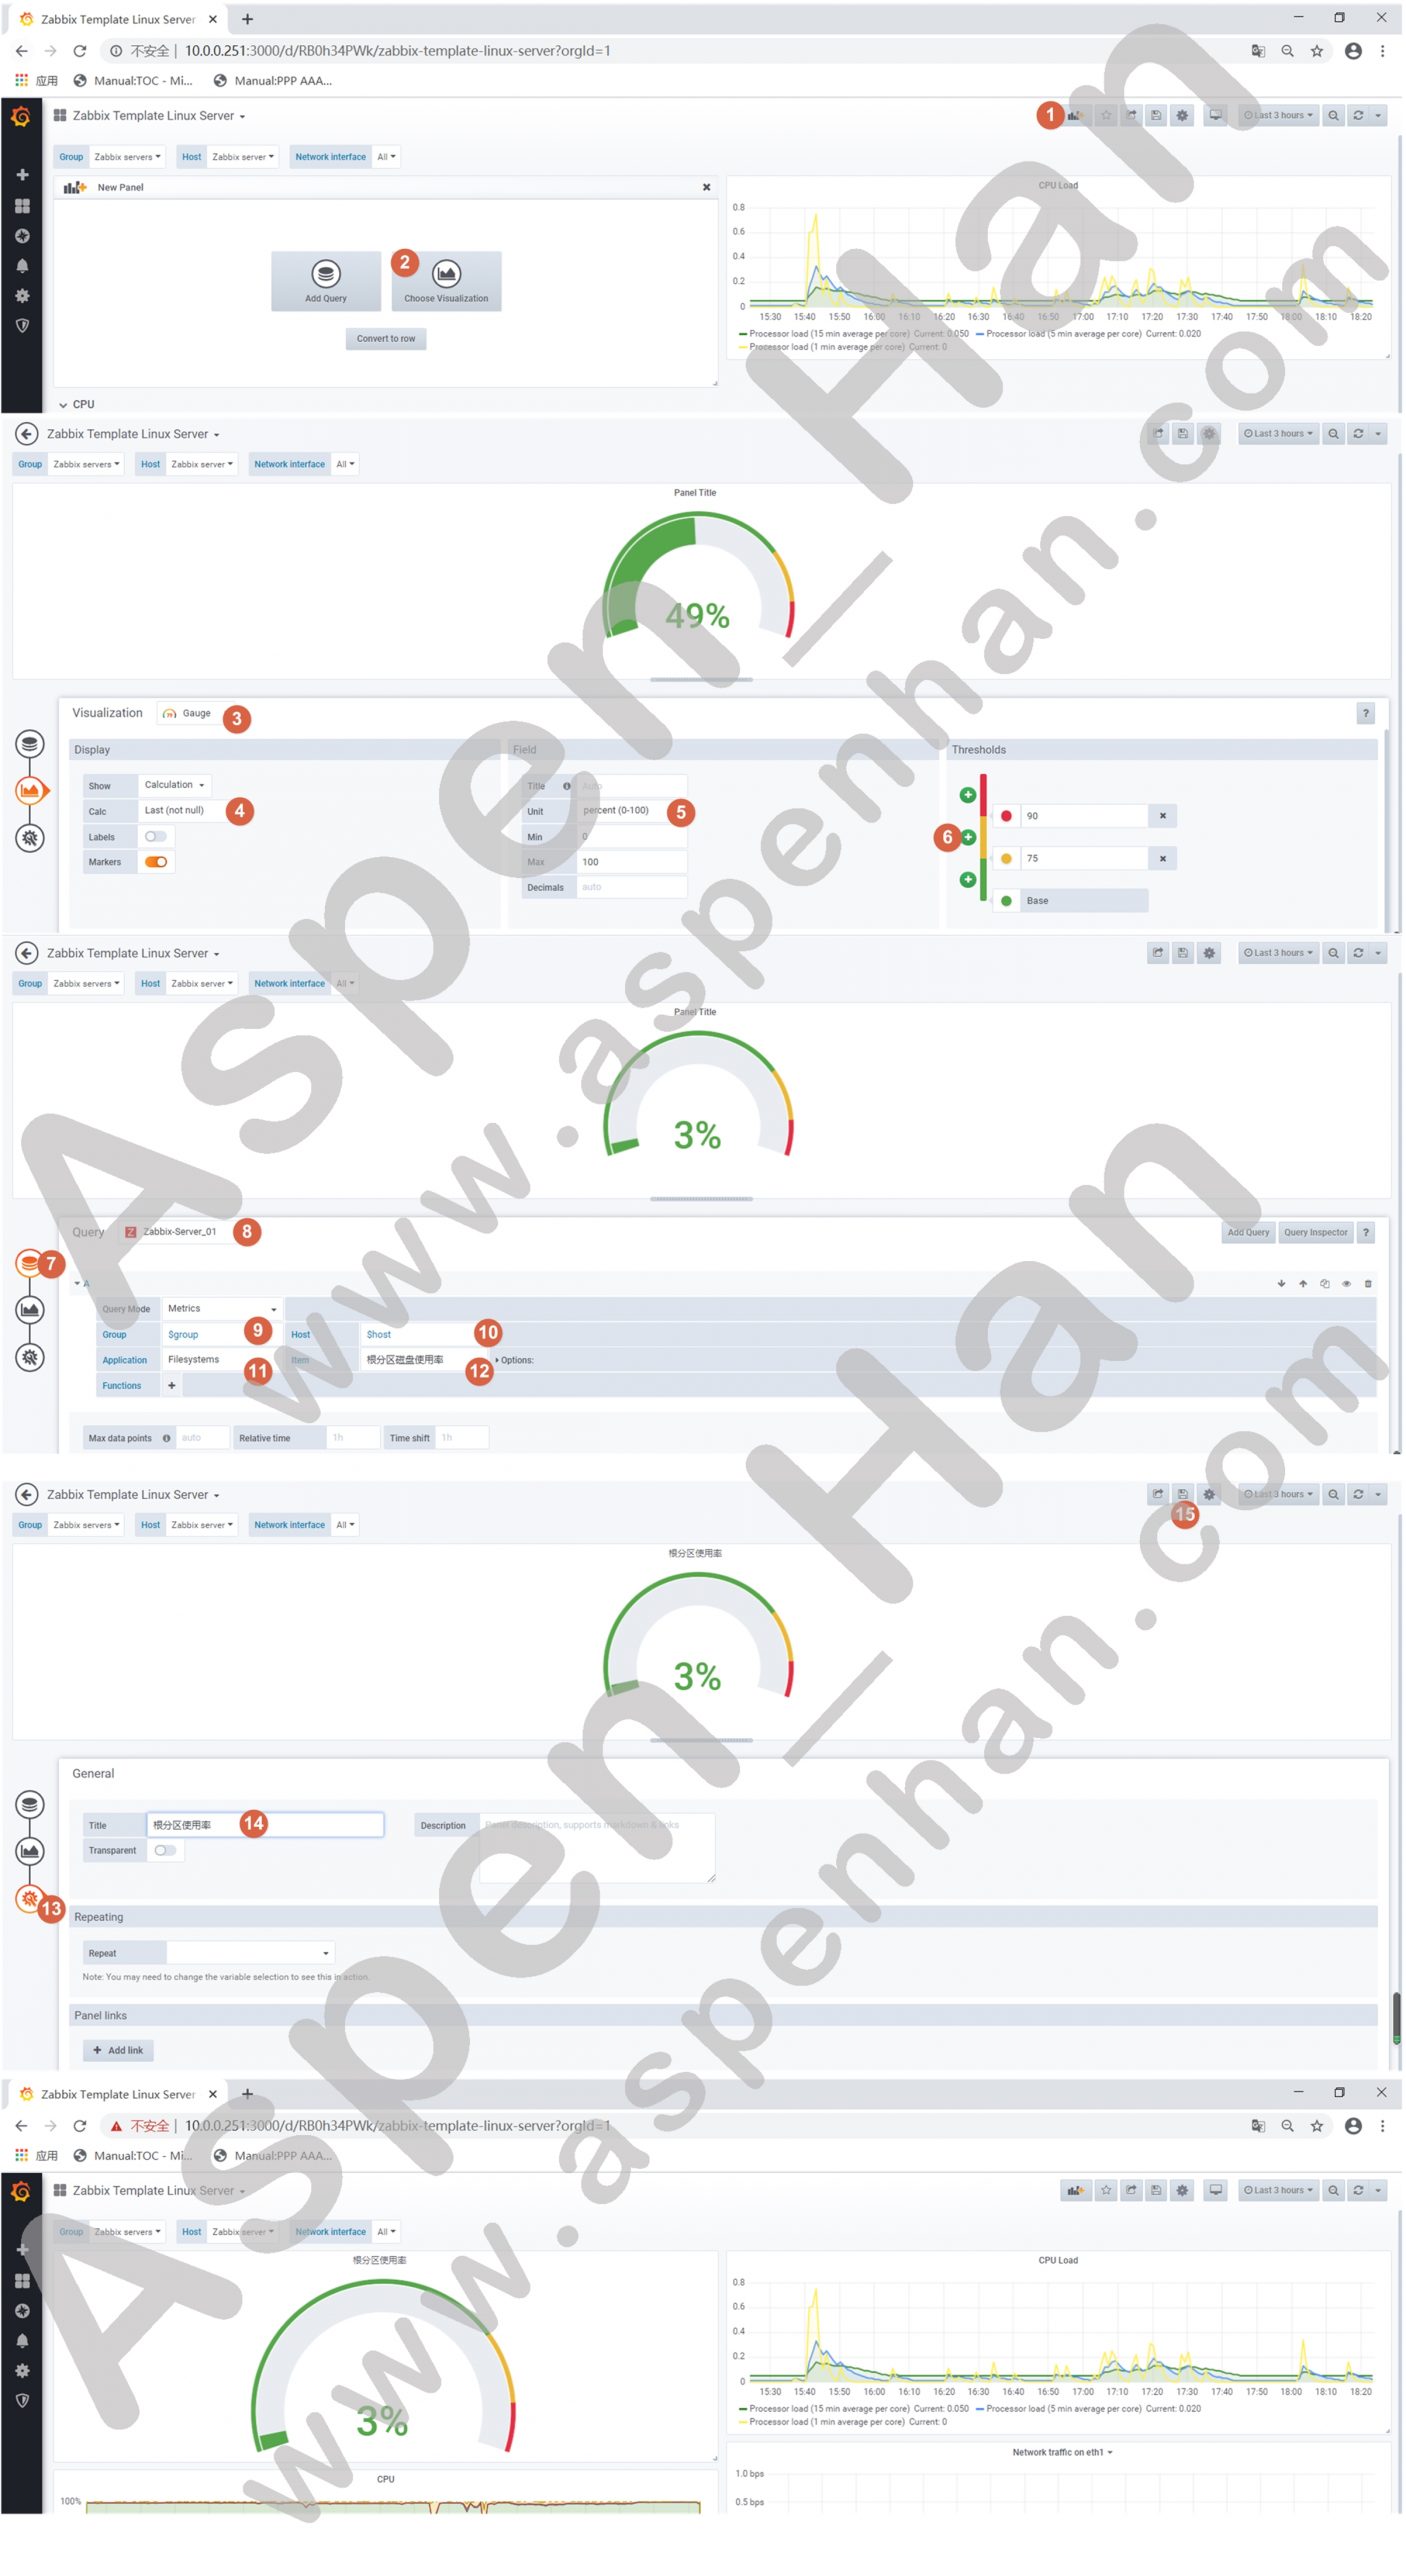
step 10 自定义图形(磁盘使用率)
# 自定义监控项
[root@zabbix-server /etc/zabbix/zabbix_agentd.d]# cat userparameter_disk.conf
UserParameter=sda.tps,iostat | awk '/^sda/ {print $2}'
UserParameter=root_usage,df -h | grep -w '/' | awk '{print $(NF-1)}'|tr -d '%'
#重启zabbix-agent
[root@zabbix-server /etc/zabbix/zabbix_agentd.d]# systemctl restart zabbix-agent.service| Add panel -> Choose Visualization |
三、监控、触发器与报警
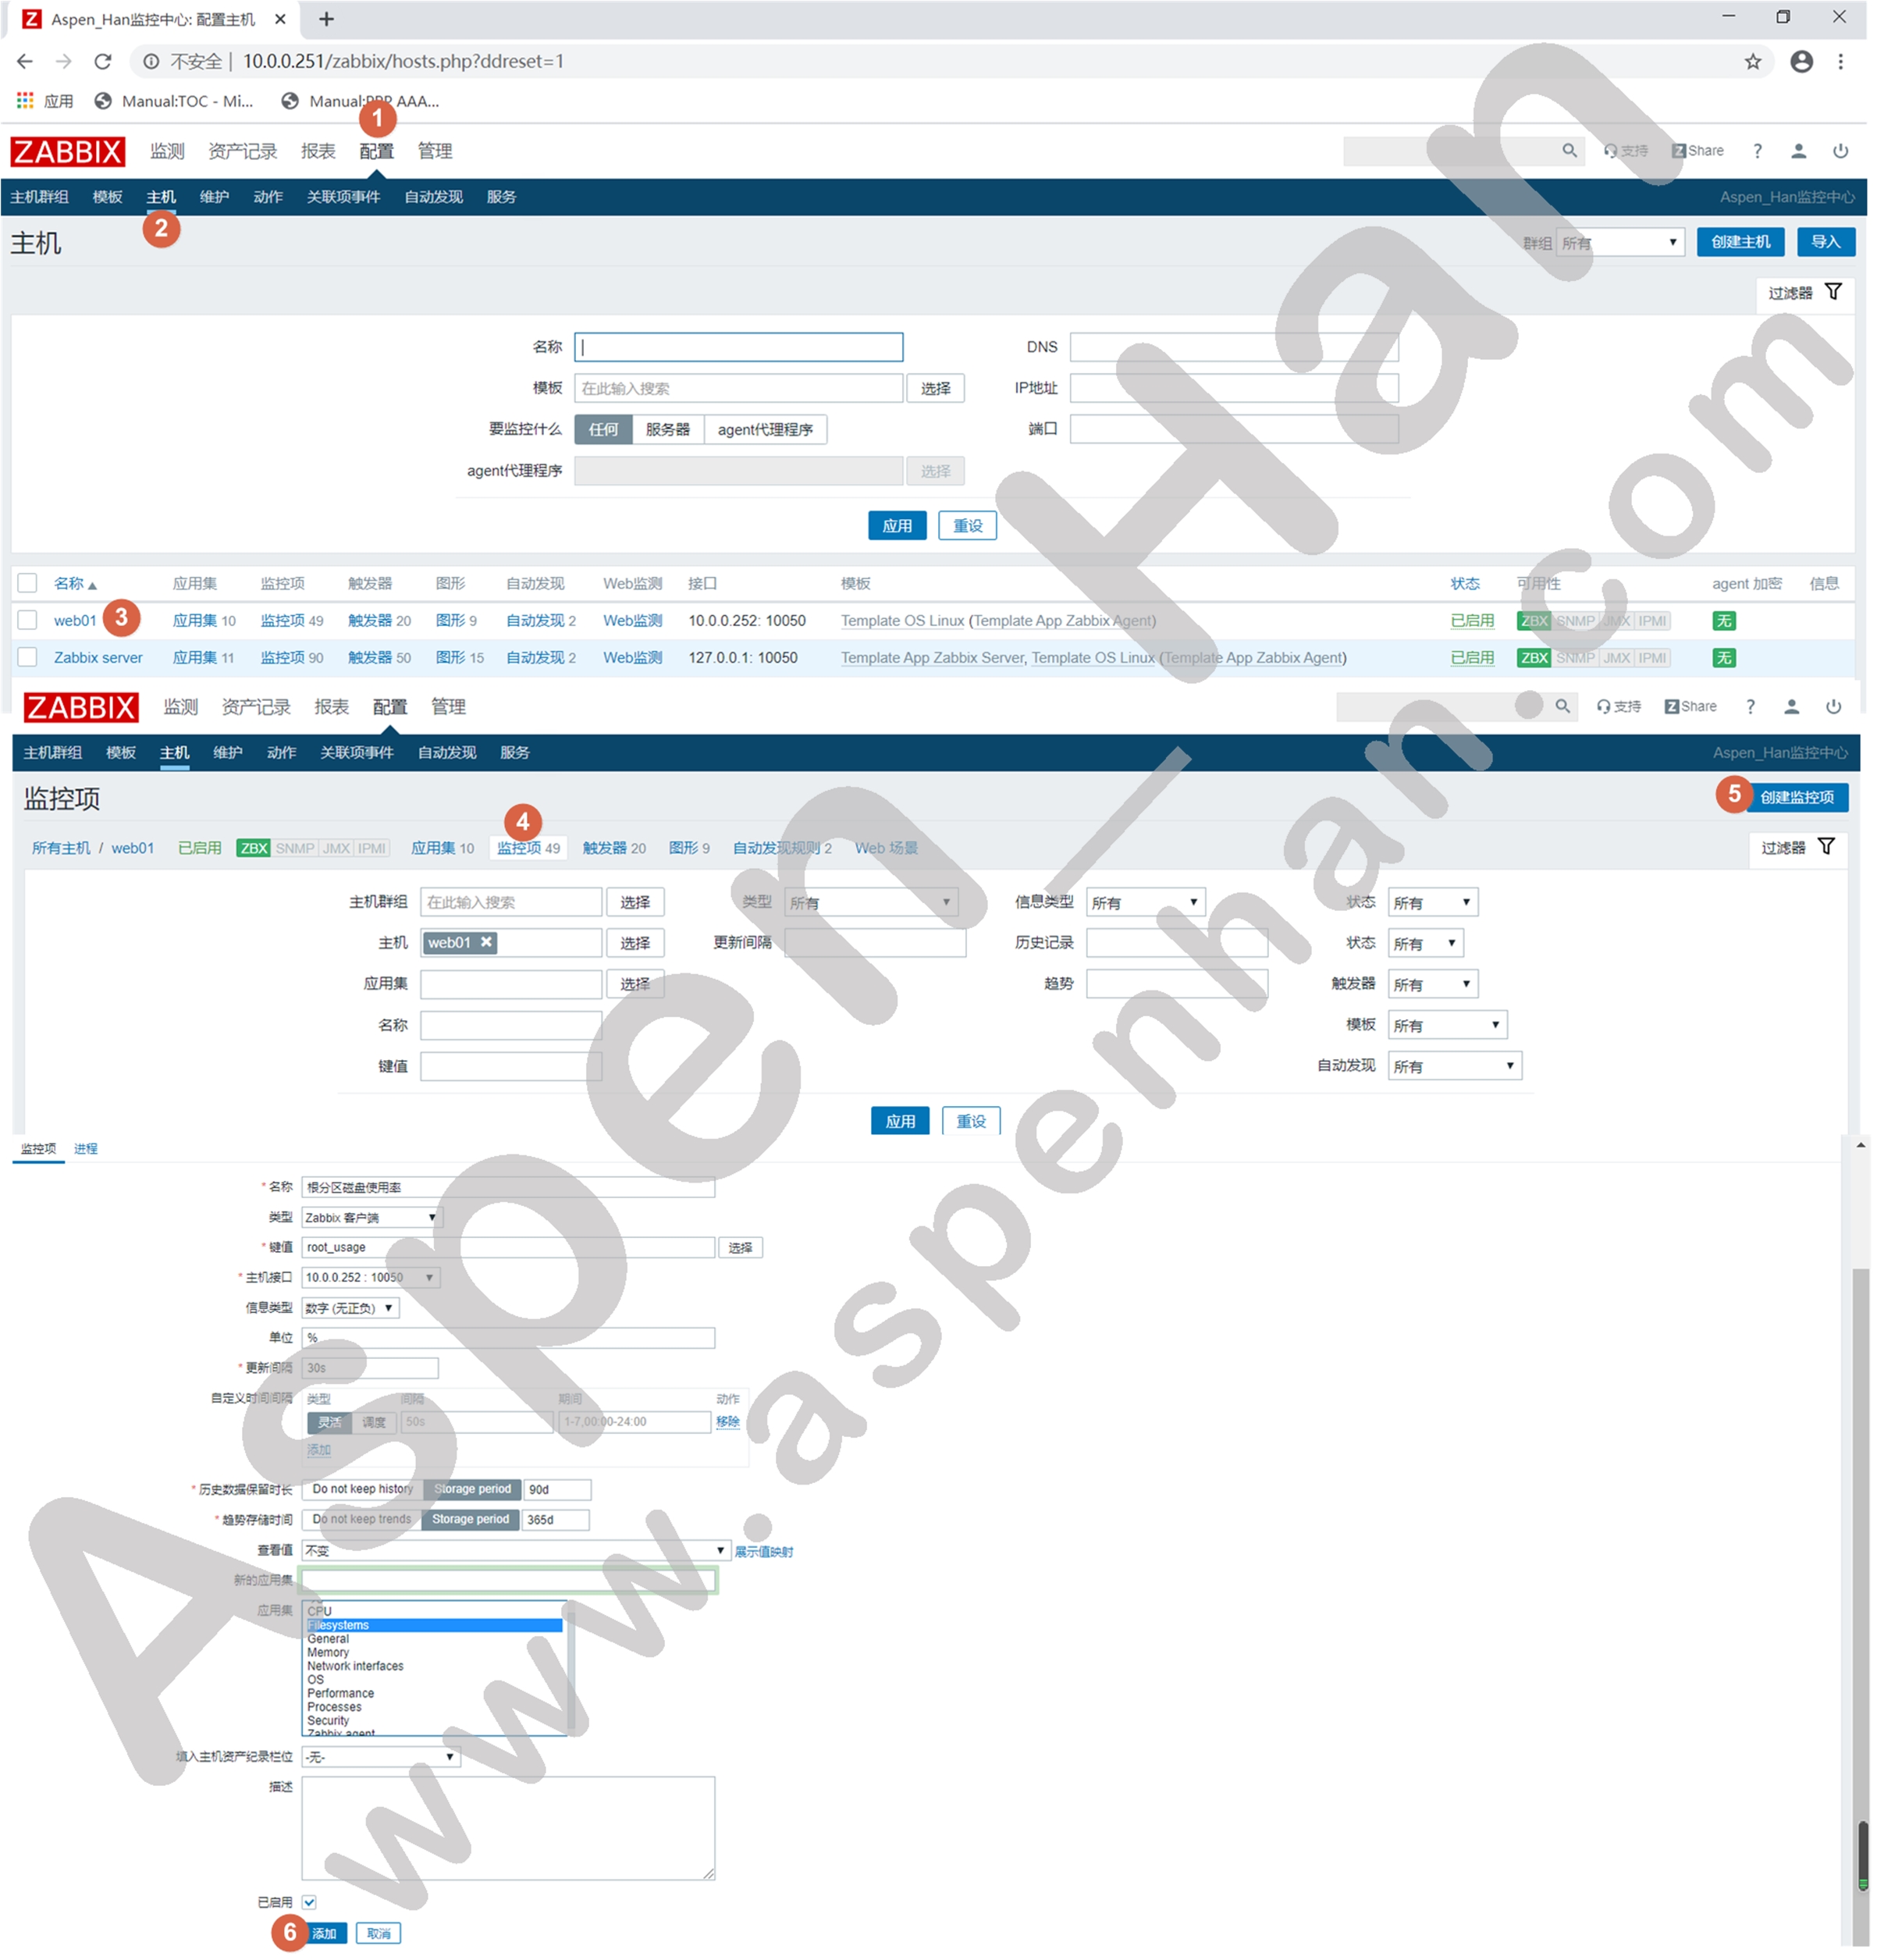
1. 自定义监控项
step 1 命令行或脚本取得监控值
本文以监控tps为例
[root@zabbix-web /tmp]# iostat
Linux 3.10.0-957.el7.x86_64 (zabbix-web)    01/09/2020  _x86_64_    (1 CPU)

avg-cpu:  %user   %nice %system %iowait  %steal   %idle
           0.06    0.00    0.16    0.05    0.00   99.73

Device:            tps    kB_read/s    kB_wrtn/s    kB_read    kB_wrtn
sda               0.46        10.60         6.25     246928     145612
scd0              0.00         0.04         0.00       1028          0

[root@zabbix-web /tmp]# iostat | awk '/^sda/ {print $2}'
0.46
step 2 定义监控项
|
每个监控项的键名必须唯一 监控项定义的键名必须与Web端添加的键名一致 |
|
#include=/etc/zabbix/zabbix_agentd.d/*.conf UserParameter=键名,取值命令 |
[root@zabbix-web /etc/zabbix/zabbix_agentd.d]# pwd
/etc/zabbix/zabbix_agentd.d
[root@zabbix-web /etc/zabbix/zabbix_agentd.d]# cat userparameter_disk.conf
UserParameter=sda.tps,iostat | awk '/^sda/ {print $2}'|
注: 在自定义监控项中如果使用传参形式,即UserParameter=键名[*],取值命令的类型时,若取值命令含有$参数,如awk中的{print $2}需要在原本的$2参数前增加一个$符,变为{print $$2};若仍写为$2会被Zabbix当作取值需要传递的第2个参数; |
step 3 重启Zabbix-Agent
| systemctl restart zabbix-agent |
[root@zabbix-web /etc/zabbix/zabbix_agentd.d]# systemctl restart zabbix-agent.service step 4 添加监控项(Web端)
| 配置 -> 主机 -> 指定主机 -> 监控项 -> 创建监控项 |

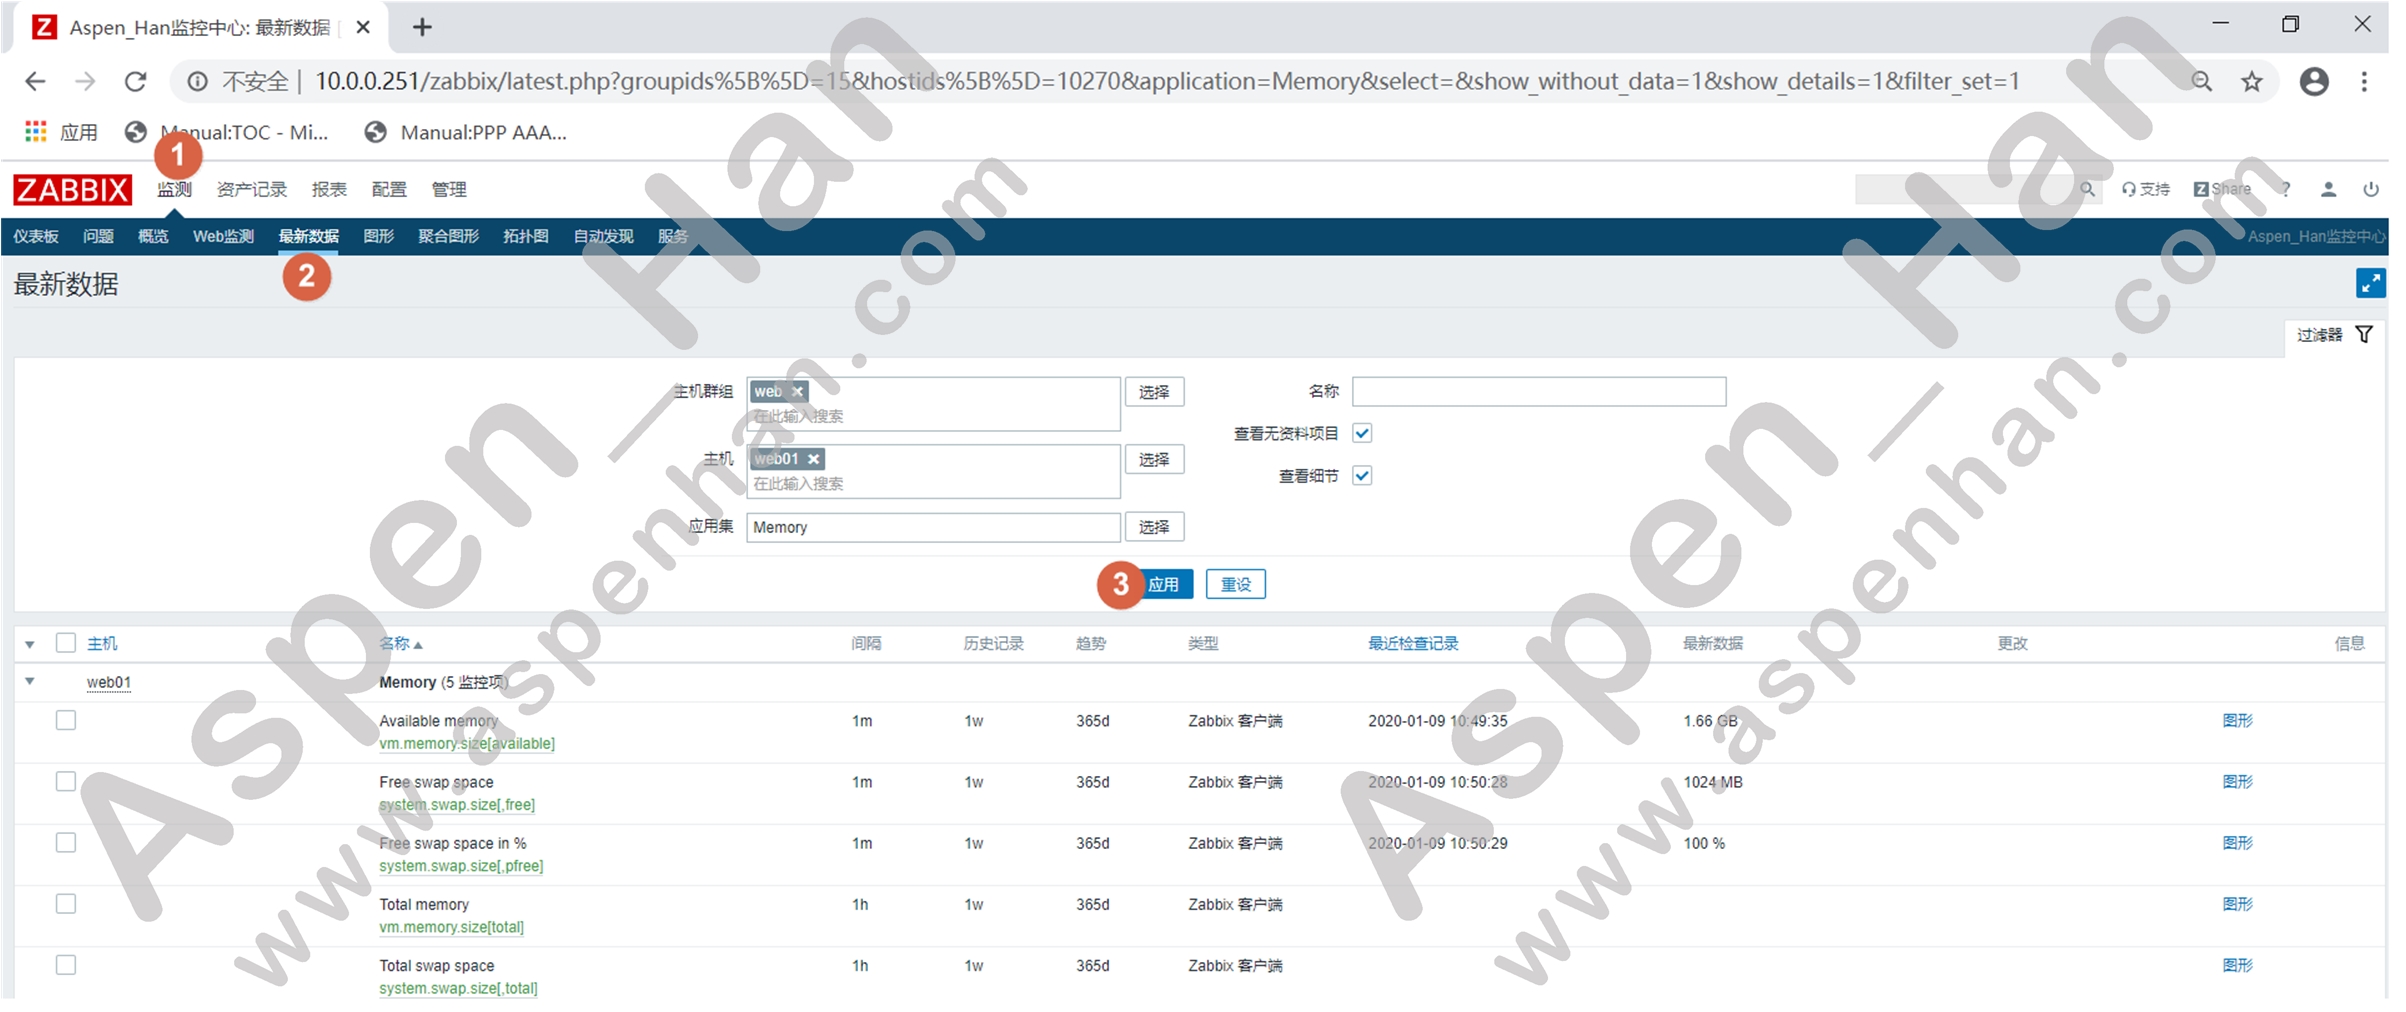
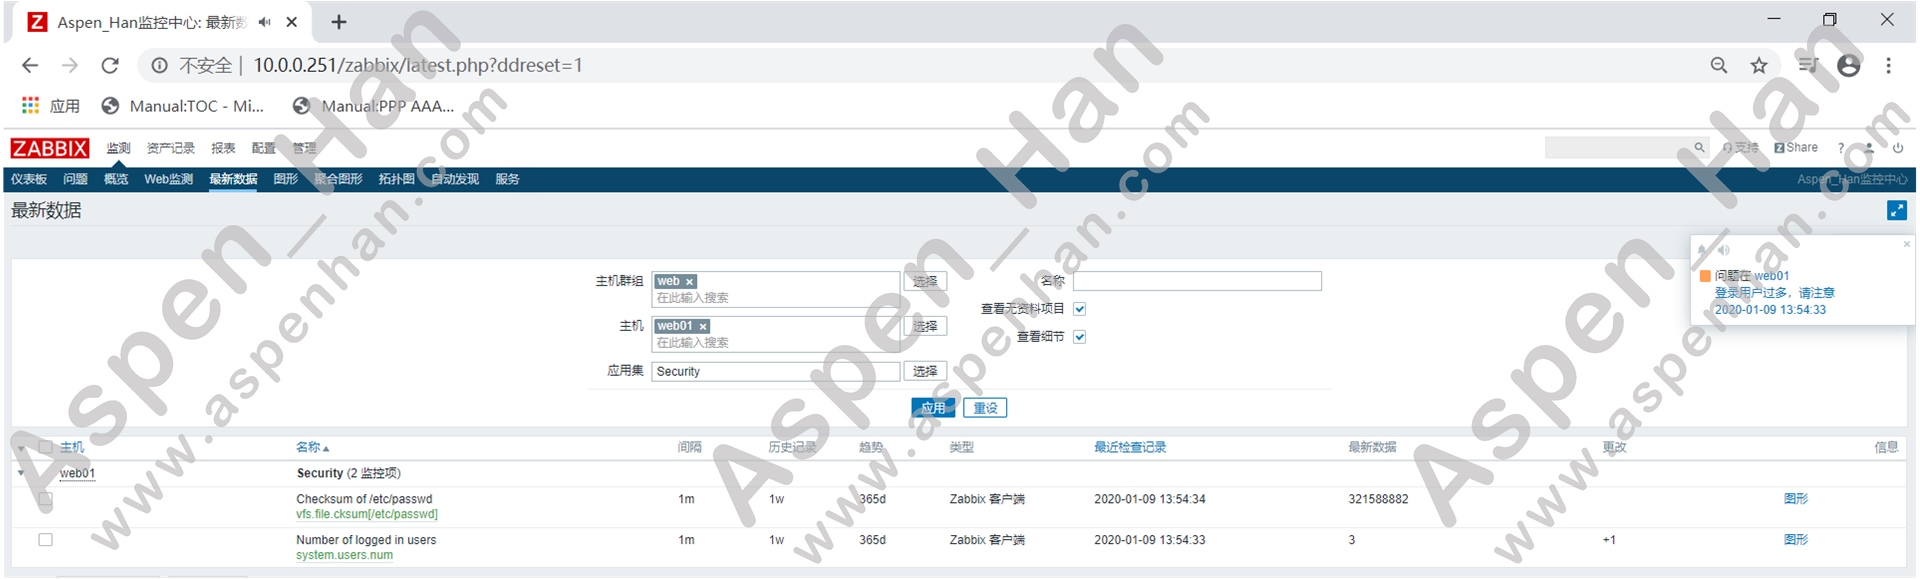
step 5 确认监控状态
| 监测 -> 最新数据 -> 指定主机 -> 应用 |

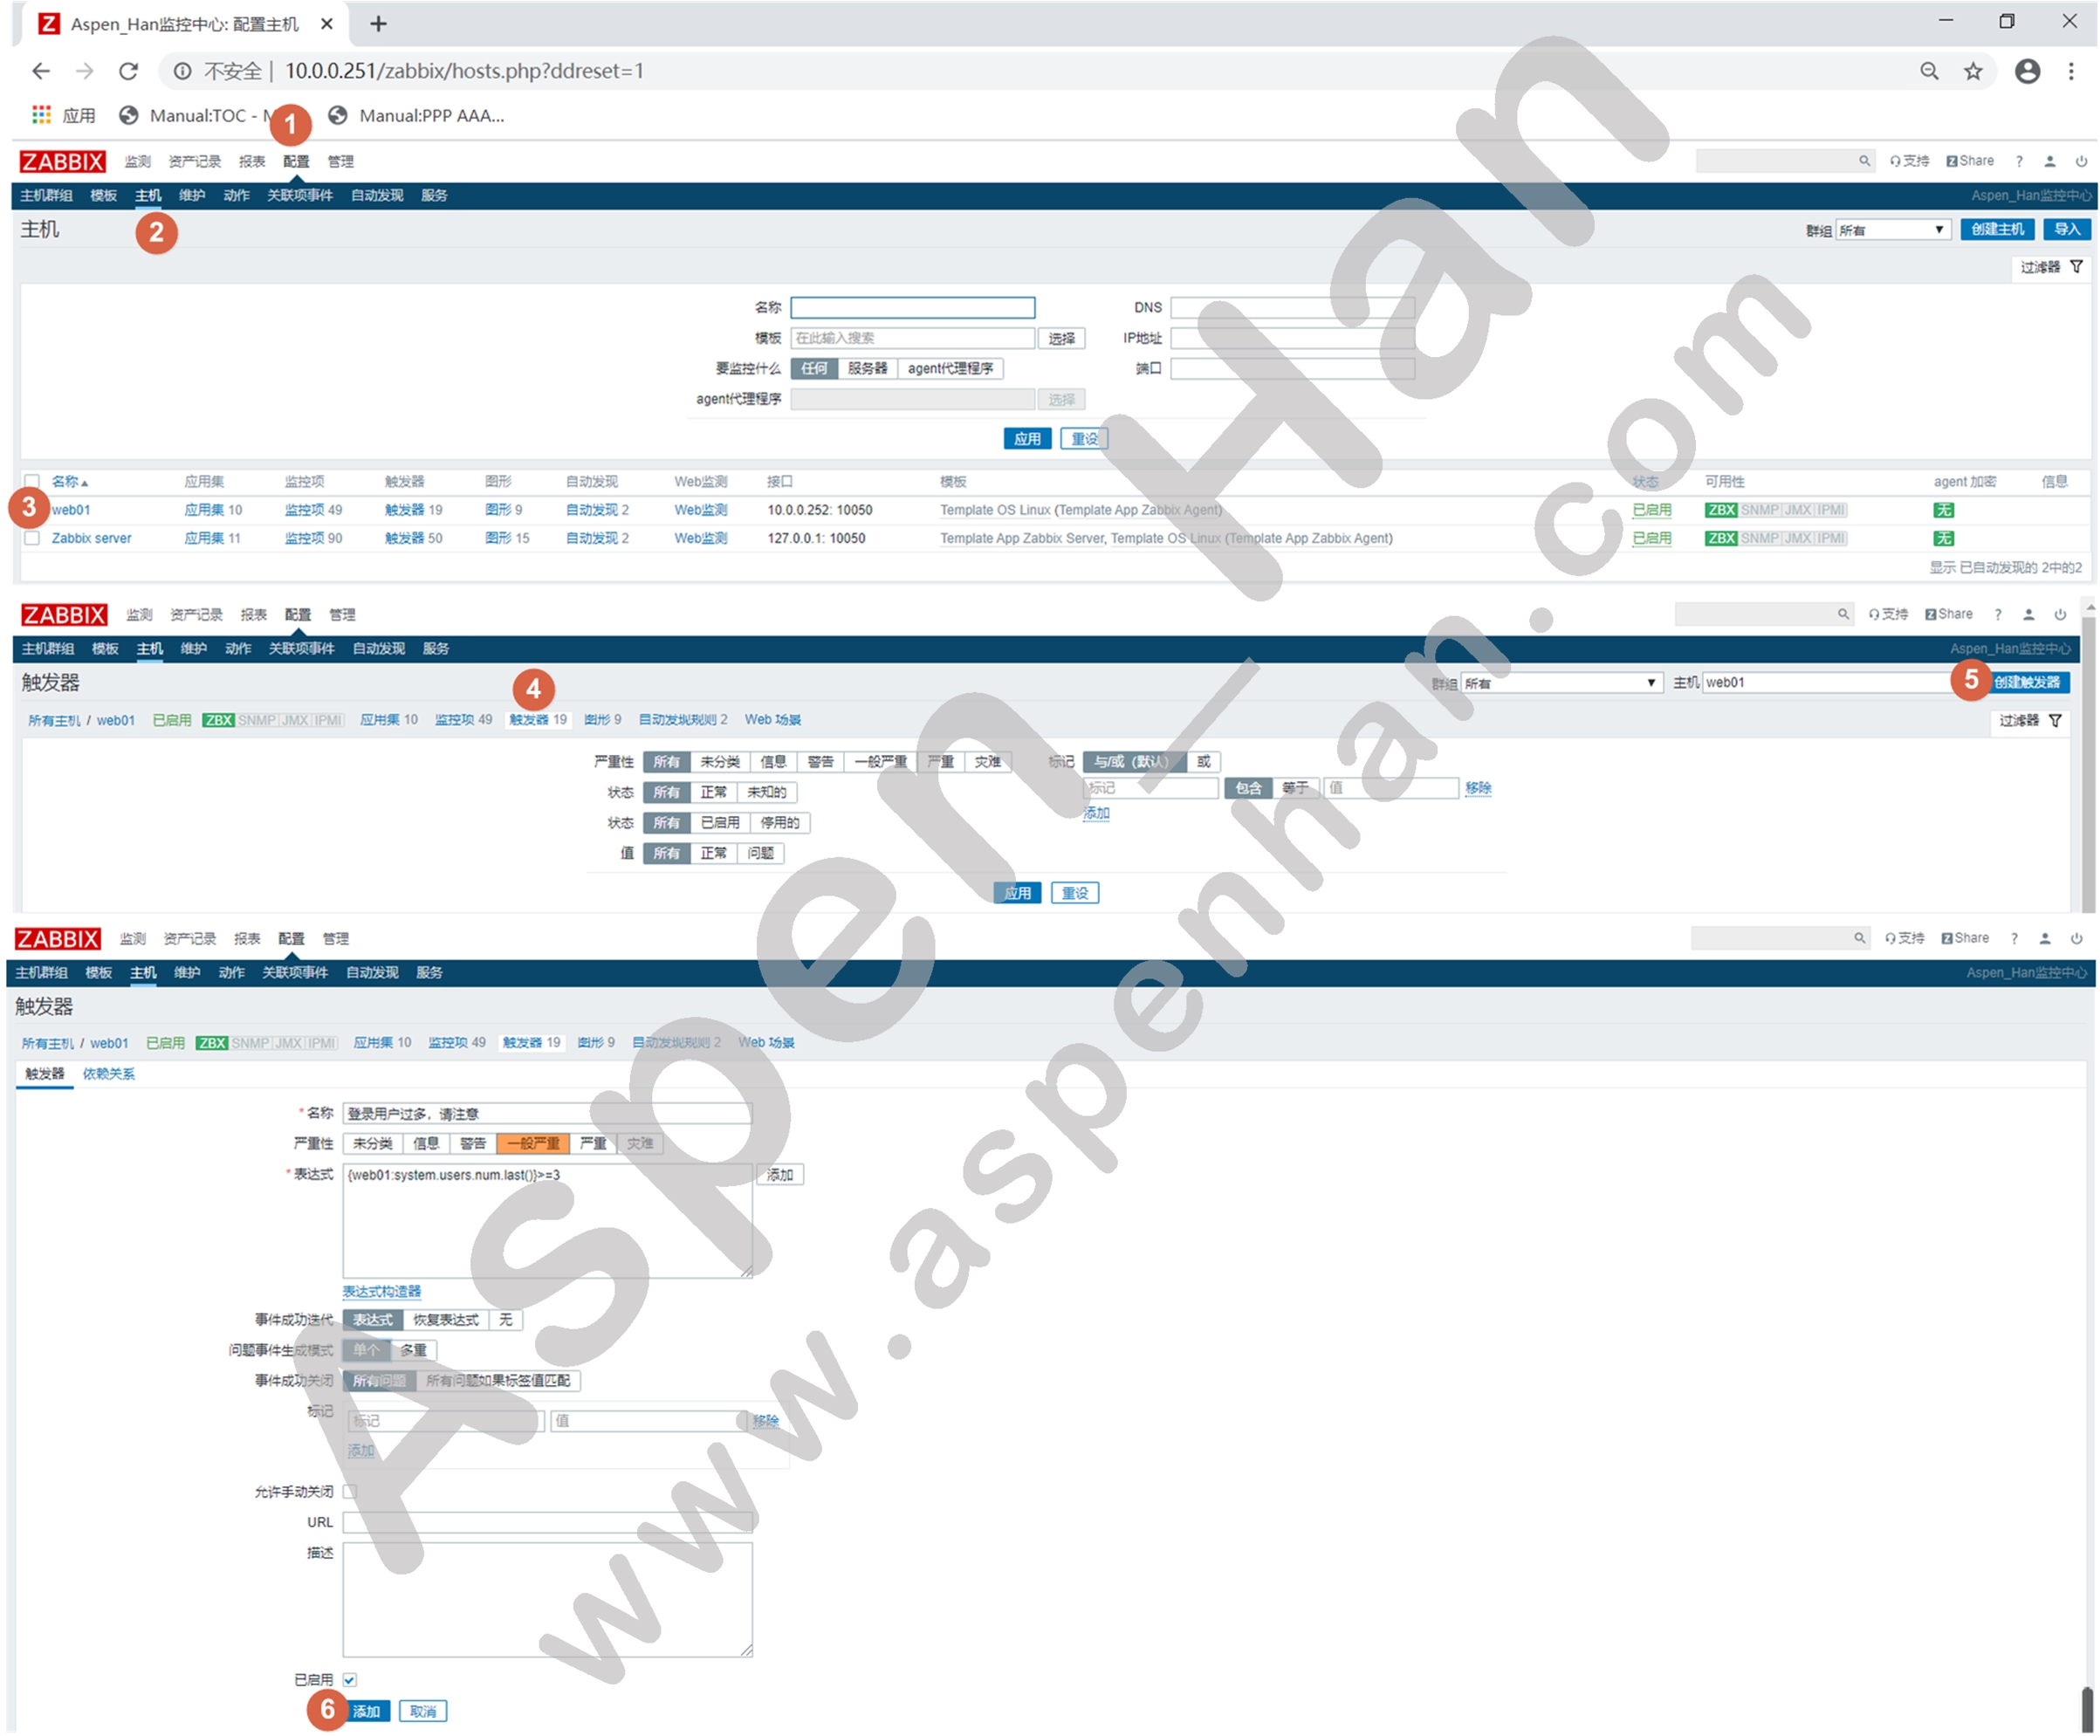
2. 自定义触发器
| 配置 -> 主机 -> 指定主机 -> 触发器 -> 创建触发器 |
| 表达式: {主机名称:监控键名.函数} |
3.自定义报警
- 邮件报警
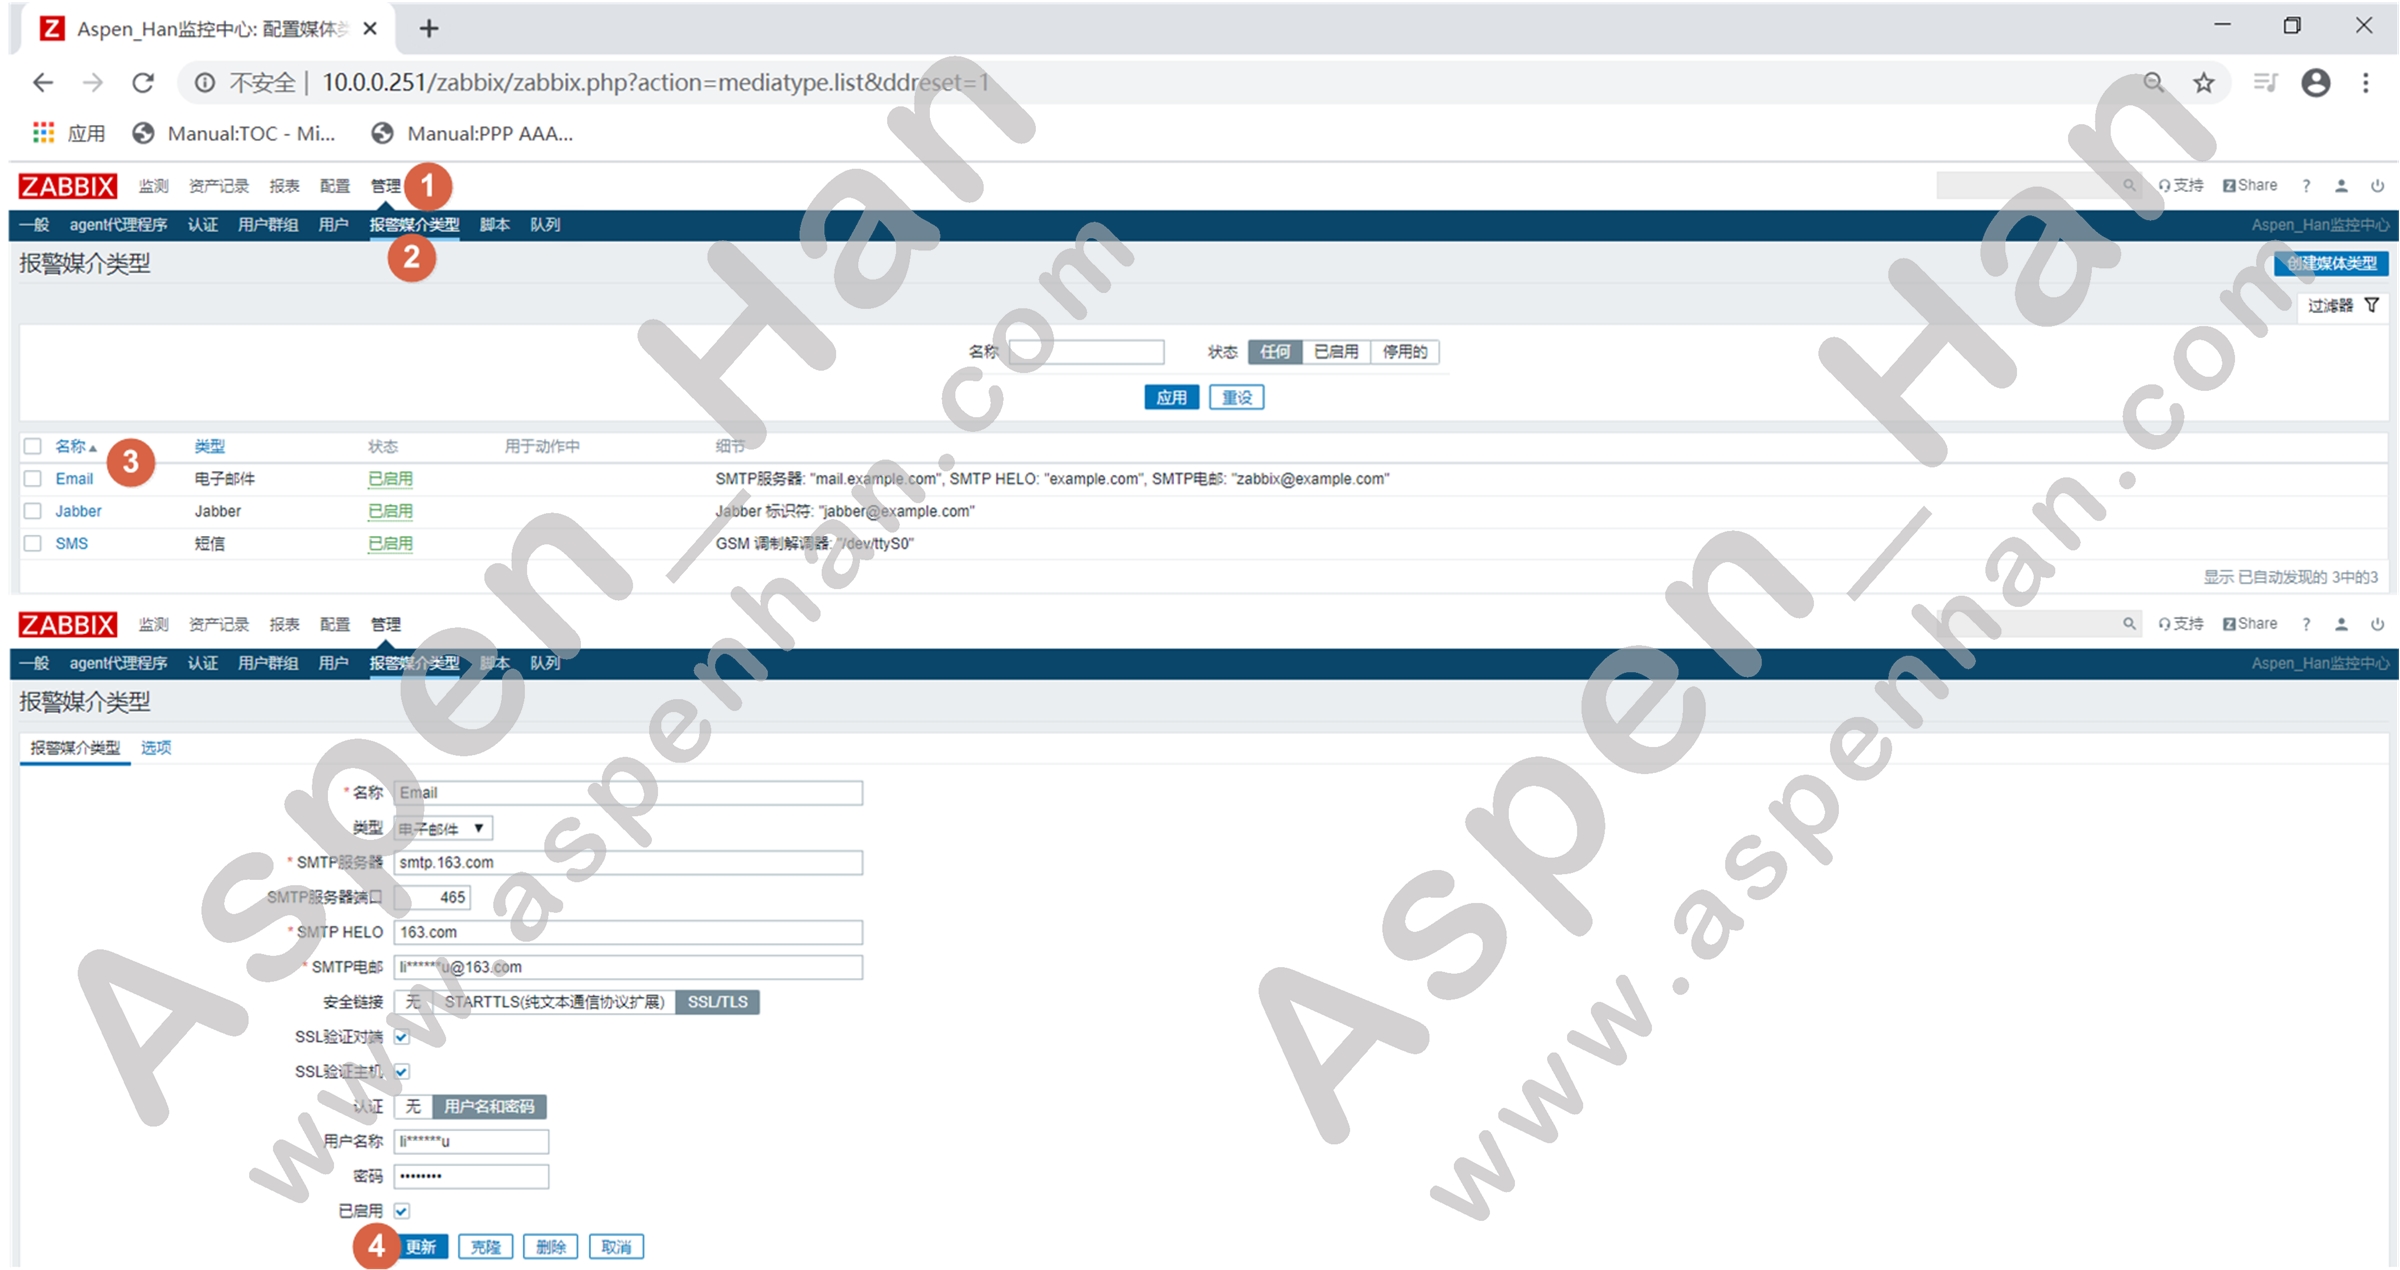
step 1 配置发信邮箱
| 管理 -> 报警媒介类型 -> Email |
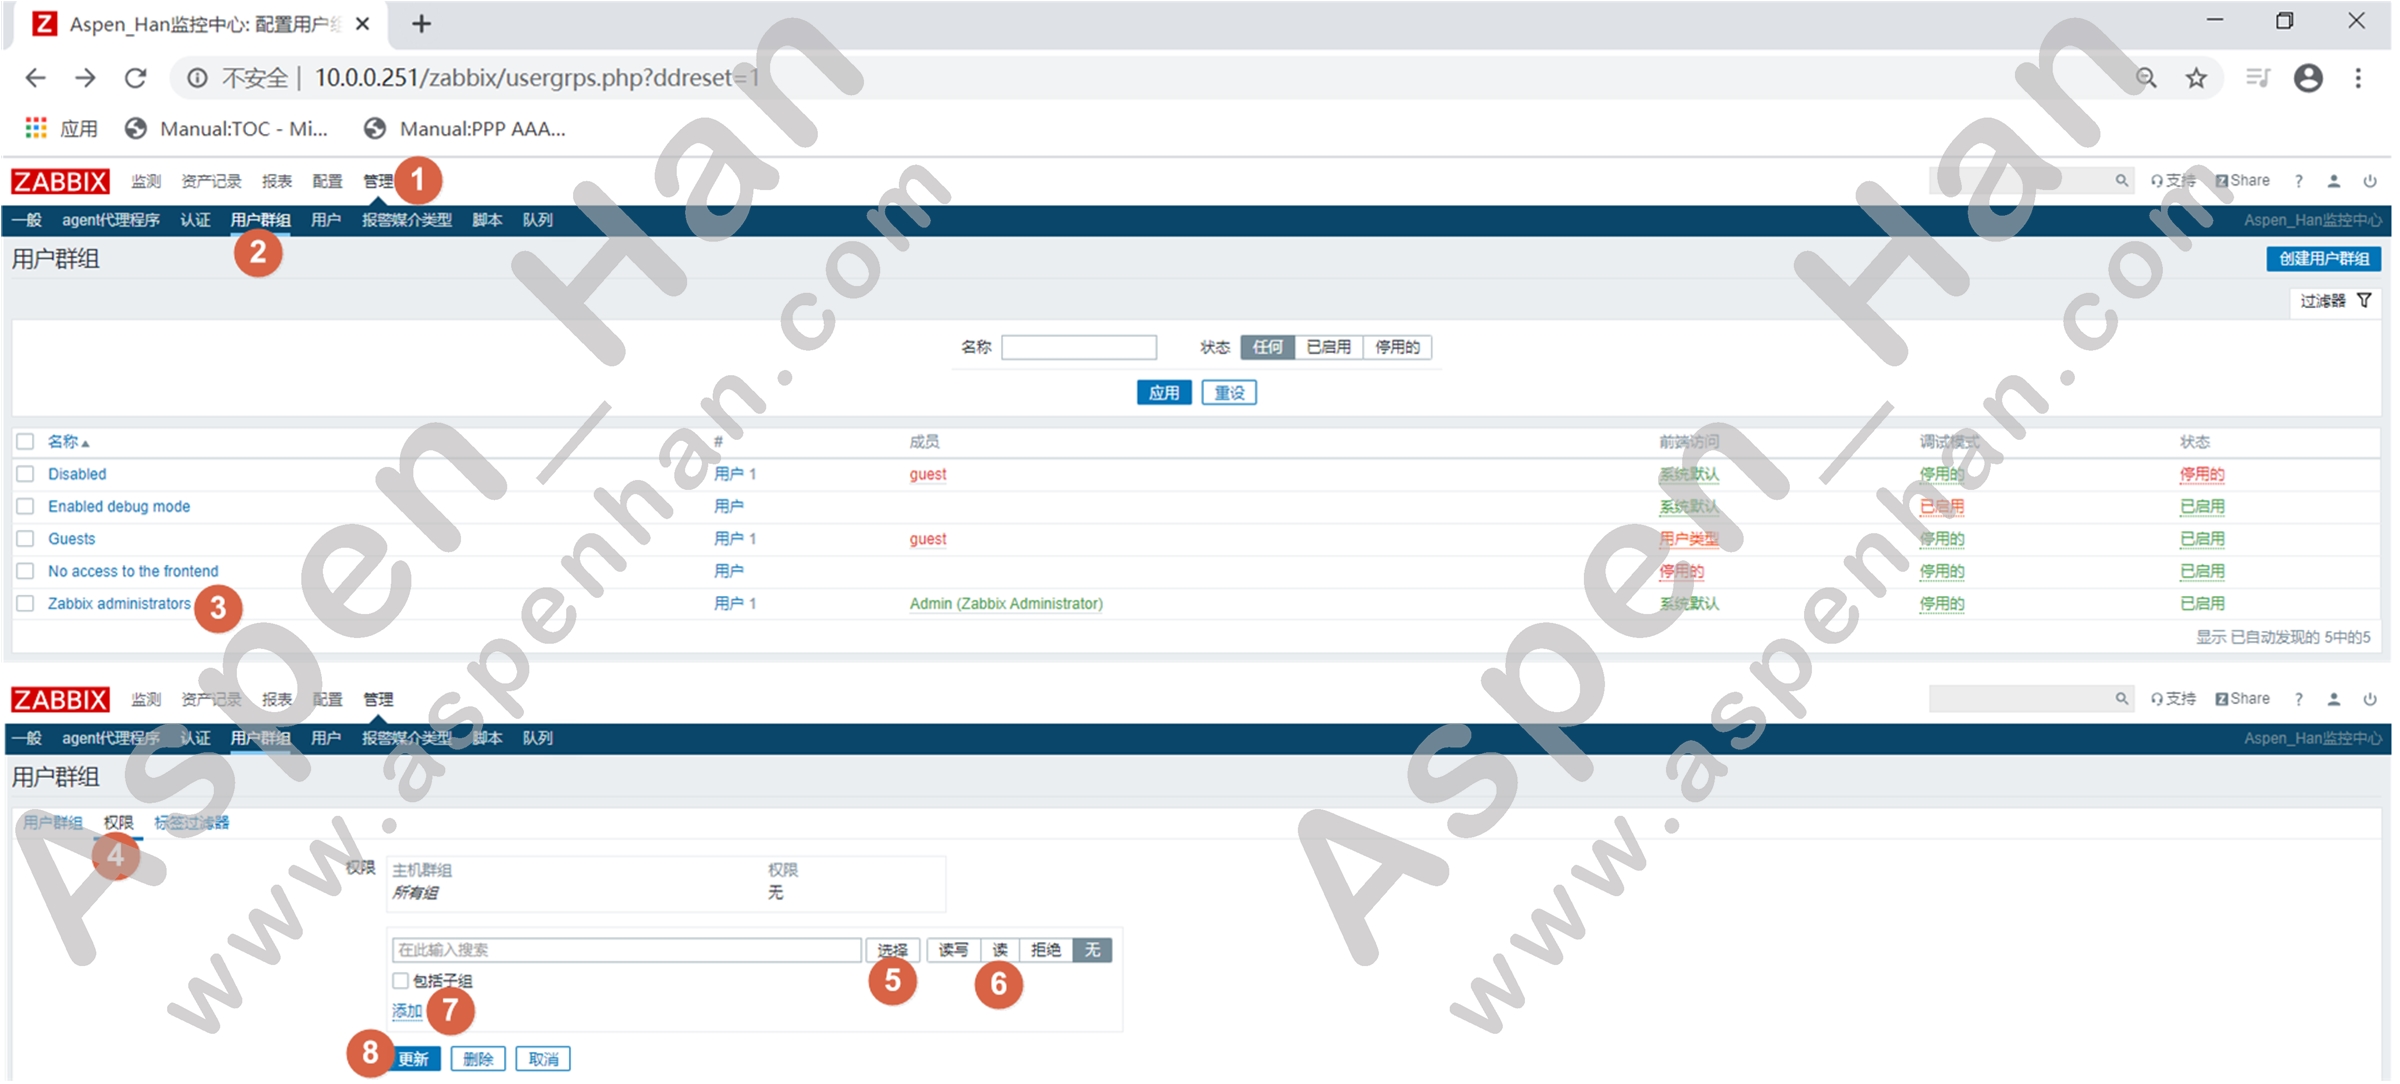
step 2 配置收信邮箱
Zabbix支持多用户,每个用户都可以配置单独的收件人
| 管理 -> 用户群组 -> 指定用户组 -> 权限 |
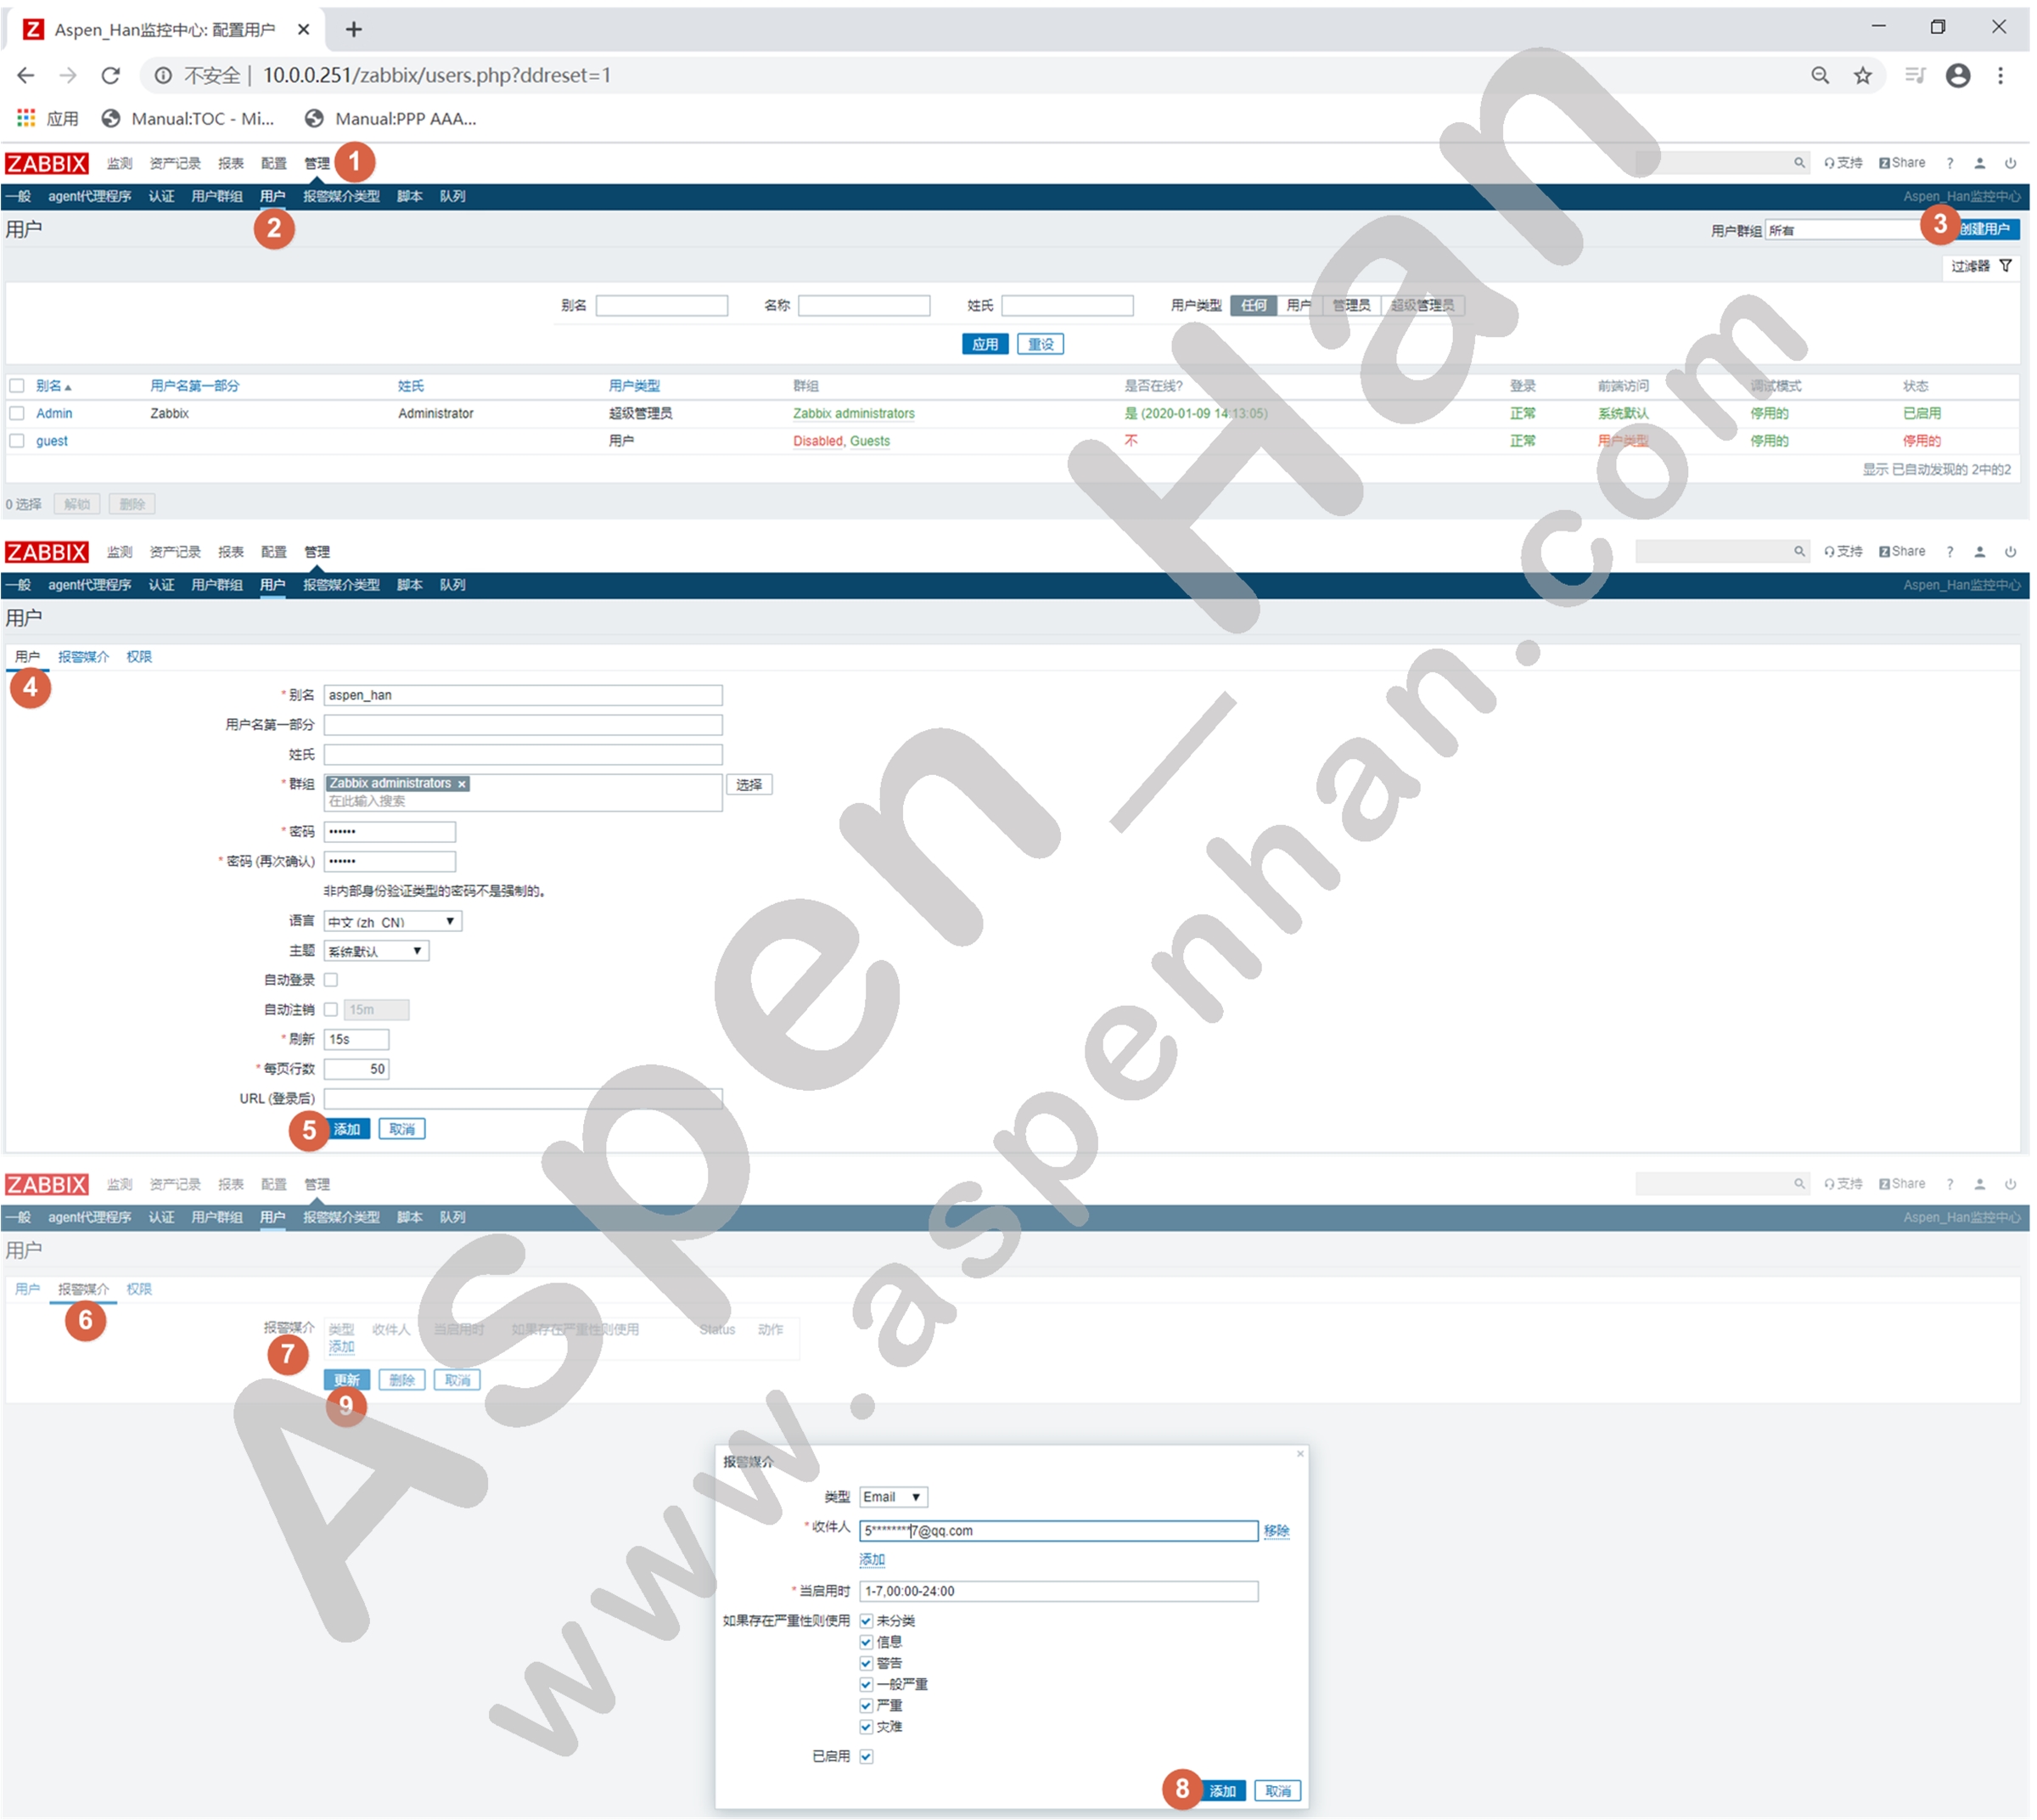
| 管理 -> 用户 -> 创建用户 -> 报警媒介 |
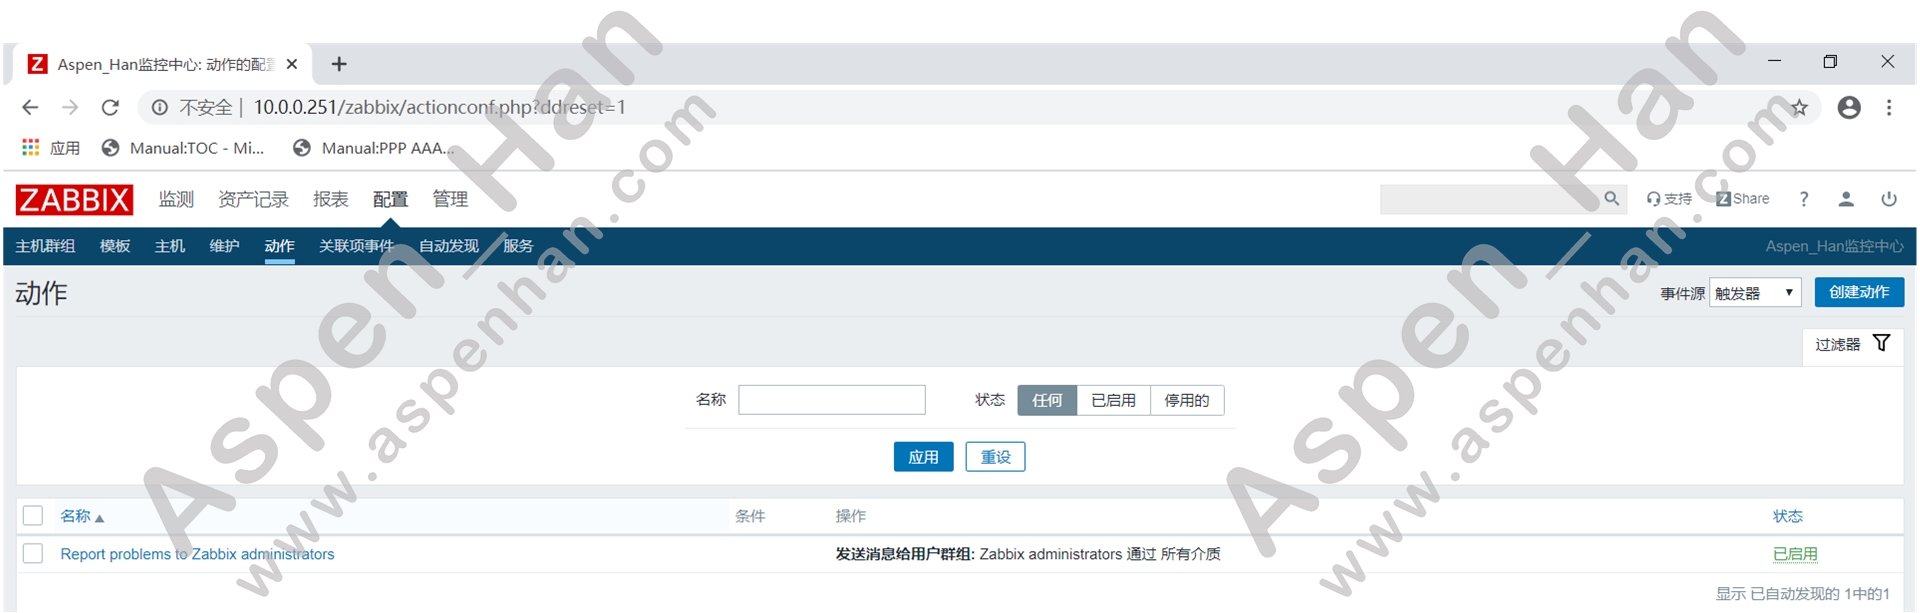
step 3 启用报警通知
| 配置 -> 动作 -> 发送消息给用户组 -> 启用 |
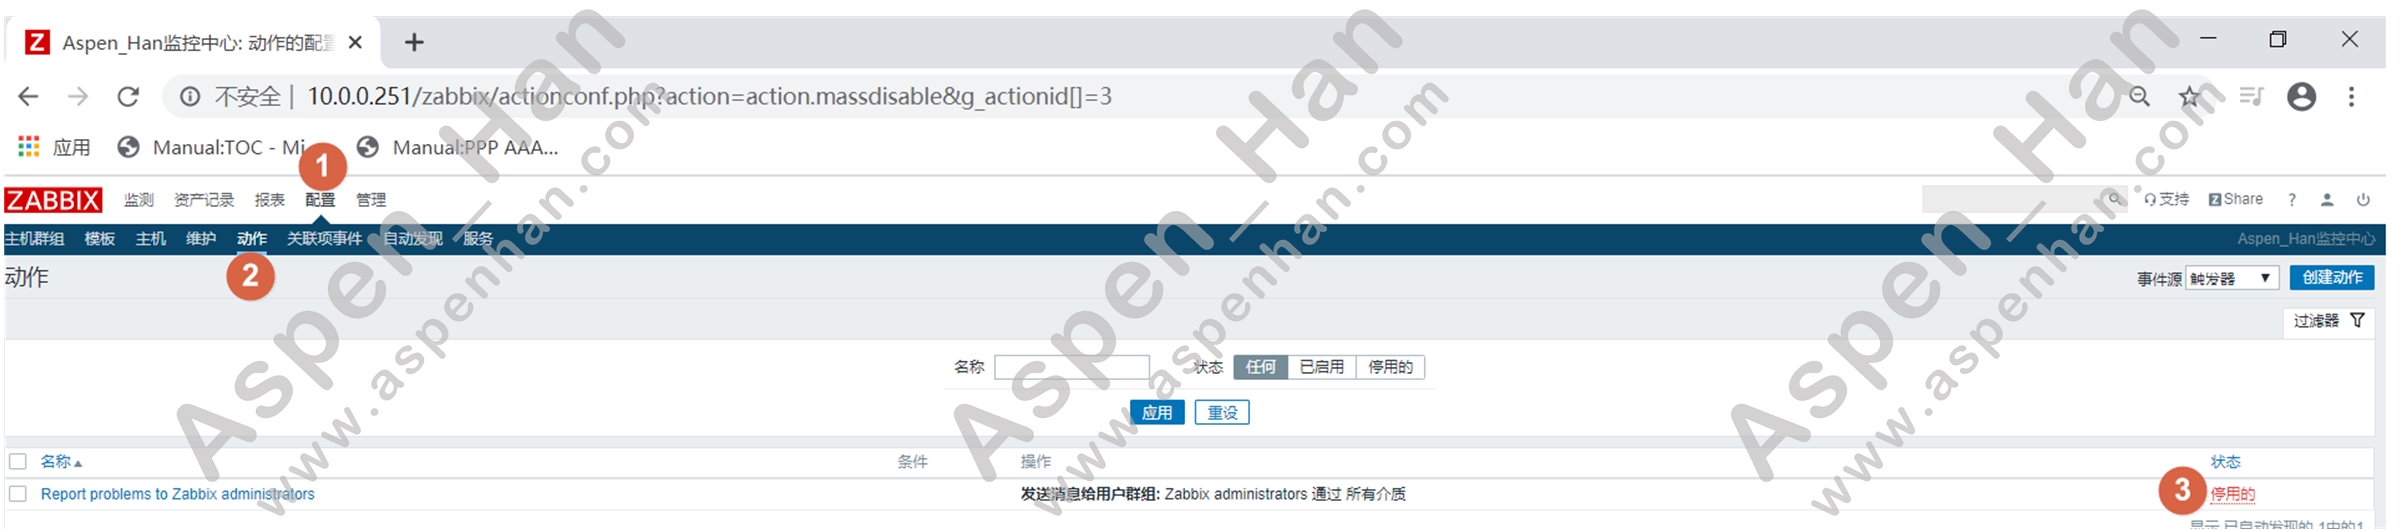
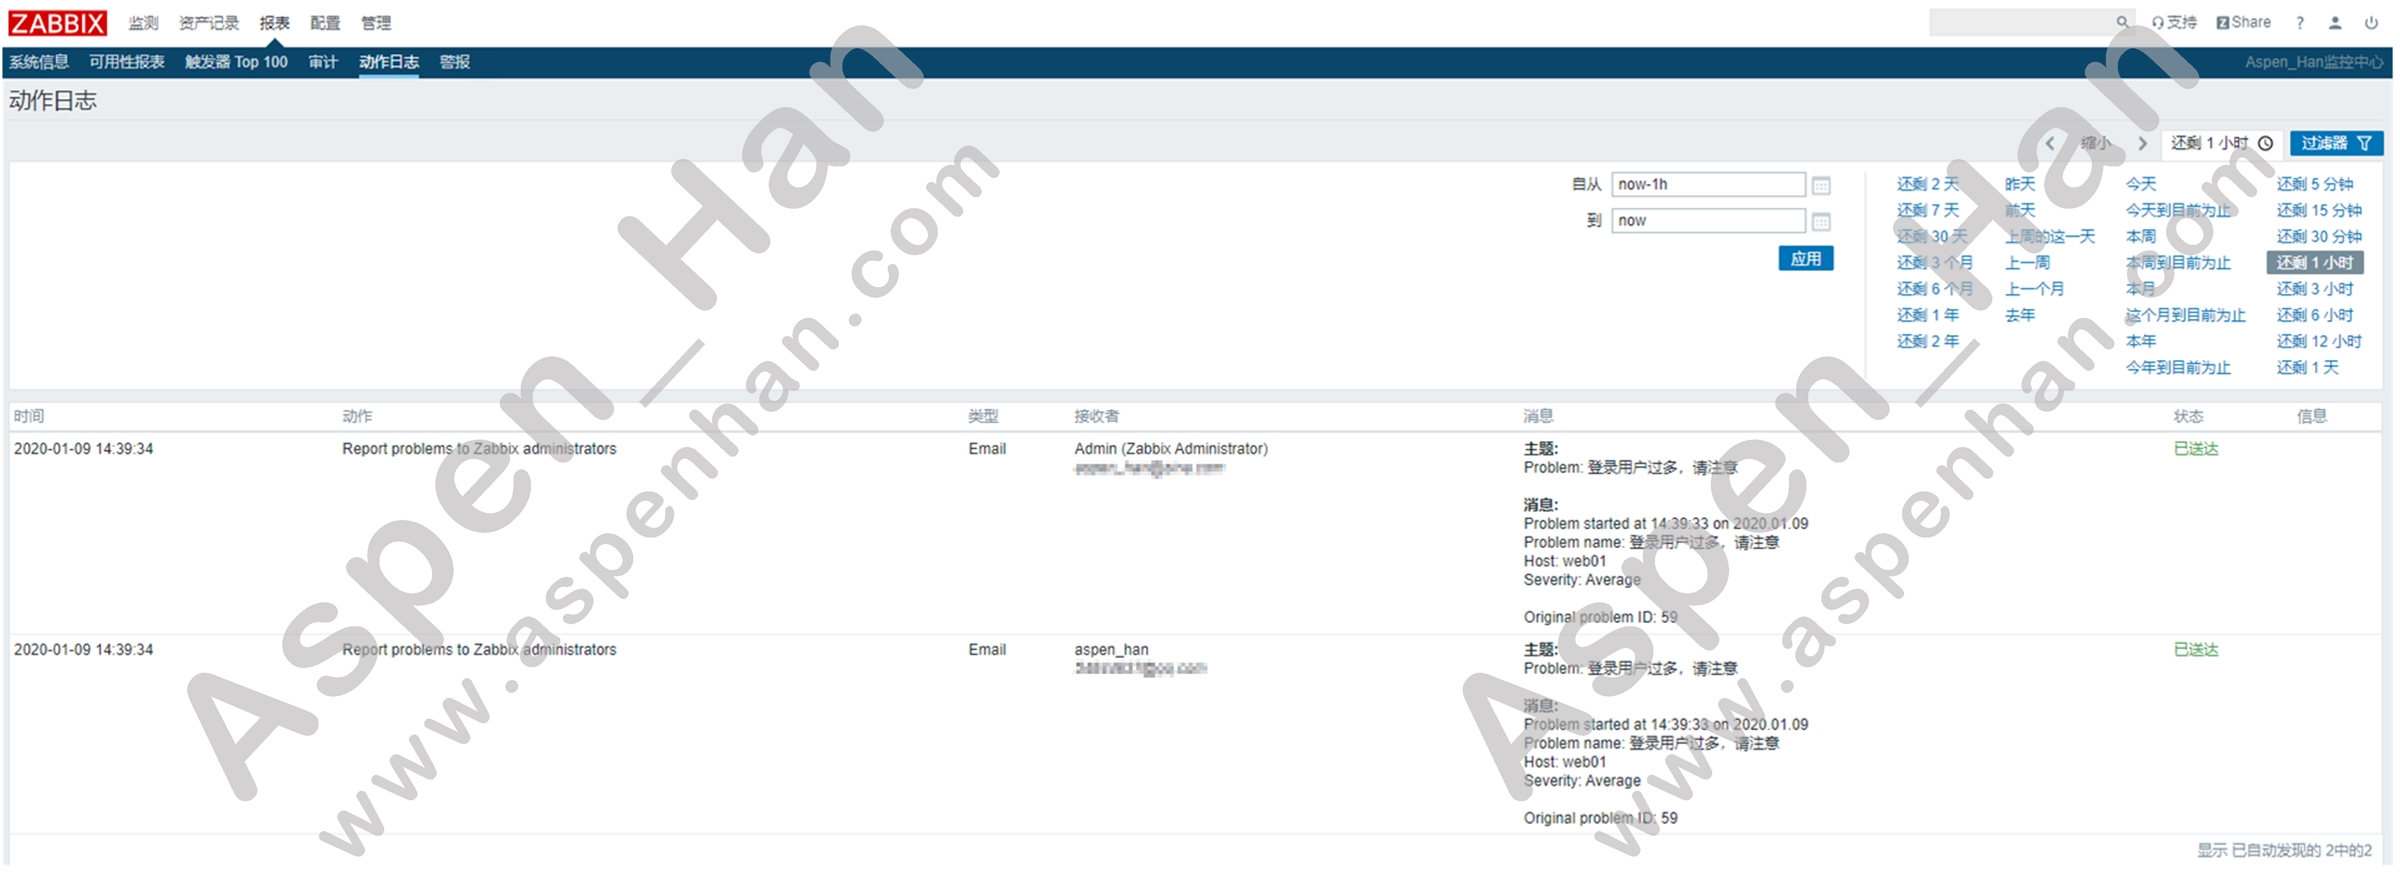
step 4 确认动作状态
| 报表 -> 动作日志 |
- 企业微信报警
| Zabbix原生不支持微信报警 |
step 1 上传微信报警脚本至Zabbix Server指定目录
微信脚本下载地址
| AlertScriptsPath=/usr/lib/zabbix/alertscripts |
[root@zabbix-server ~]# grep -Ev '#|^$' /etc/zabbix/zabbix_server.conf
LogFile=/var/log/zabbix/zabbix_server.log
LogFileSize=0
PidFile=/var/run/zabbix/zabbix_server.pid
SocketDir=/var/run/zabbix
DBHost=localhost
DBName=zabbix
DBUser=zabbix
DBPassword=123456
SNMPTrapperFile=/var/log/snmptrap/snmptrap.log
Timeout=4
AlertScriptsPath=/usr/lib/zabbix/alertscripts
ExternalScripts=/usr/lib/zabbix/externalscripts
LogSlowQueries=3000
[root@zabbix-server /usr/lib/zabbix/alertscripts]# sz wechat.py
[root@zabbix-server /usr/lib/zabbix/alertscripts]# ll
total 4
-rw-r--r-- 1 root root 1319 Jan  9 15:01 wechat.py
step 2 配置脚本运行环境
|
yum install -y python-pip pip install requests -i https://pypi.tuna.tsinghua.edu.cn/simple |
[root@zabbix-server /usr/lib/zabbix/alertscripts]# yum install -y python-pip
Loaded plugins: fastestmirror
...
  python-setuptools.noarch 0:0.9.8-7.el7

Complete!
[root@zabbix-server /usr/lib/zabbix/alertscripts]# pip install requests -i https://pypi.tuna.tsinghua.edu.cn/simple
Collecting requests
  Downloading https://pypi.tuna.tsinghua.edu.cn/packages/51/bd/23c926cd341ea6b7dd0b2a00aba99ae0f828be89d72b2190f27c11d4b7fb/requests-2.22.0-py2.py3-none-any.whl (57kB)
    100% |████████████████████████████████| 61kB 8.4MB/s
...
step 3 企业微信添加报警机器人
*获取企业ID、应用ID和机器人授权码

step 4 配置脚本
|
corpid='企业ID' appsecret='微信授权码' agentid=应用ID |
[root@zabbix-server /usr/lib/zabbix/alertscripts]# awk 'NR==17,NR==19' wechat.py
corpid='w****************b'
appsecret='J*****************************************4'
agentid=1000002
step 5 测试脚本
|
python weixin.py 用户名 "标题" "内容" rm -f /tmp/weixin.log |
[root@zabbix-server /usr/lib/zabbix/alertscripts]# python wechat.py aspen_han "测试" "报警 测试"
[root@zabbix-server /usr/lib/zabbix/alertscripts]# tail -3 /tmp/weixin.log
Thu, 09 Jan 2020 15:41:41, wechat.py, INFO, sendto:aspen_han;;subject:测试;;message:测试

报警测试
[root@zabbix-server /usr/lib/zabbix/alertscripts]# rm -rf /tmp/weixin.log
step 6 添加脚本权限
| Zabbix默认用户为zabbix用户 |
| chmod +x weixin.py |
[root@zabbix-server /usr/lib/zabbix/alertscripts]# chmod +x wechat.py
[root@zabbix-server /usr/lib/zabbix/alertscripts]# ll
total 4
-rwxr-xr-x 1 root root 1325 Jan  9 15:39 wechat.py
[root@zabbix-server /usr/lib/zabbix/alertscripts]# ps -ef | grep zabbix| head -3
zabbix    11791      1  0 09:46 ?        00:00:00 /usr/sbin/zabbix_agentd -c /etc/zabbix/zabbix_agentd.conf
zabbix    11792  11791  0 09:46 ?        00:00:07 /usr/sbin/zabbix_agentd: collector [idle 1 sec]
zabbix    11793  11791  0 09:46 ?        00:00:01 /usr/sbin/zabbix_agentd: listener #1 [waiting for connection]
step 7 配置报警媒介
| 管理 -> 报警媒介类型 -> 创建媒介类型 |
|
脚本参数 {ALERT.SENDTO} {ALERT.SUBJECT} {ALERT.MESSAGE} |

step 8 配置收信人
| 管理 -> 用户 -> 创建用户 -> 报警媒介 |

step 9 启用报警通知
| 配置 -> 动作 -> 发送消息给用户组 -> 启用 |
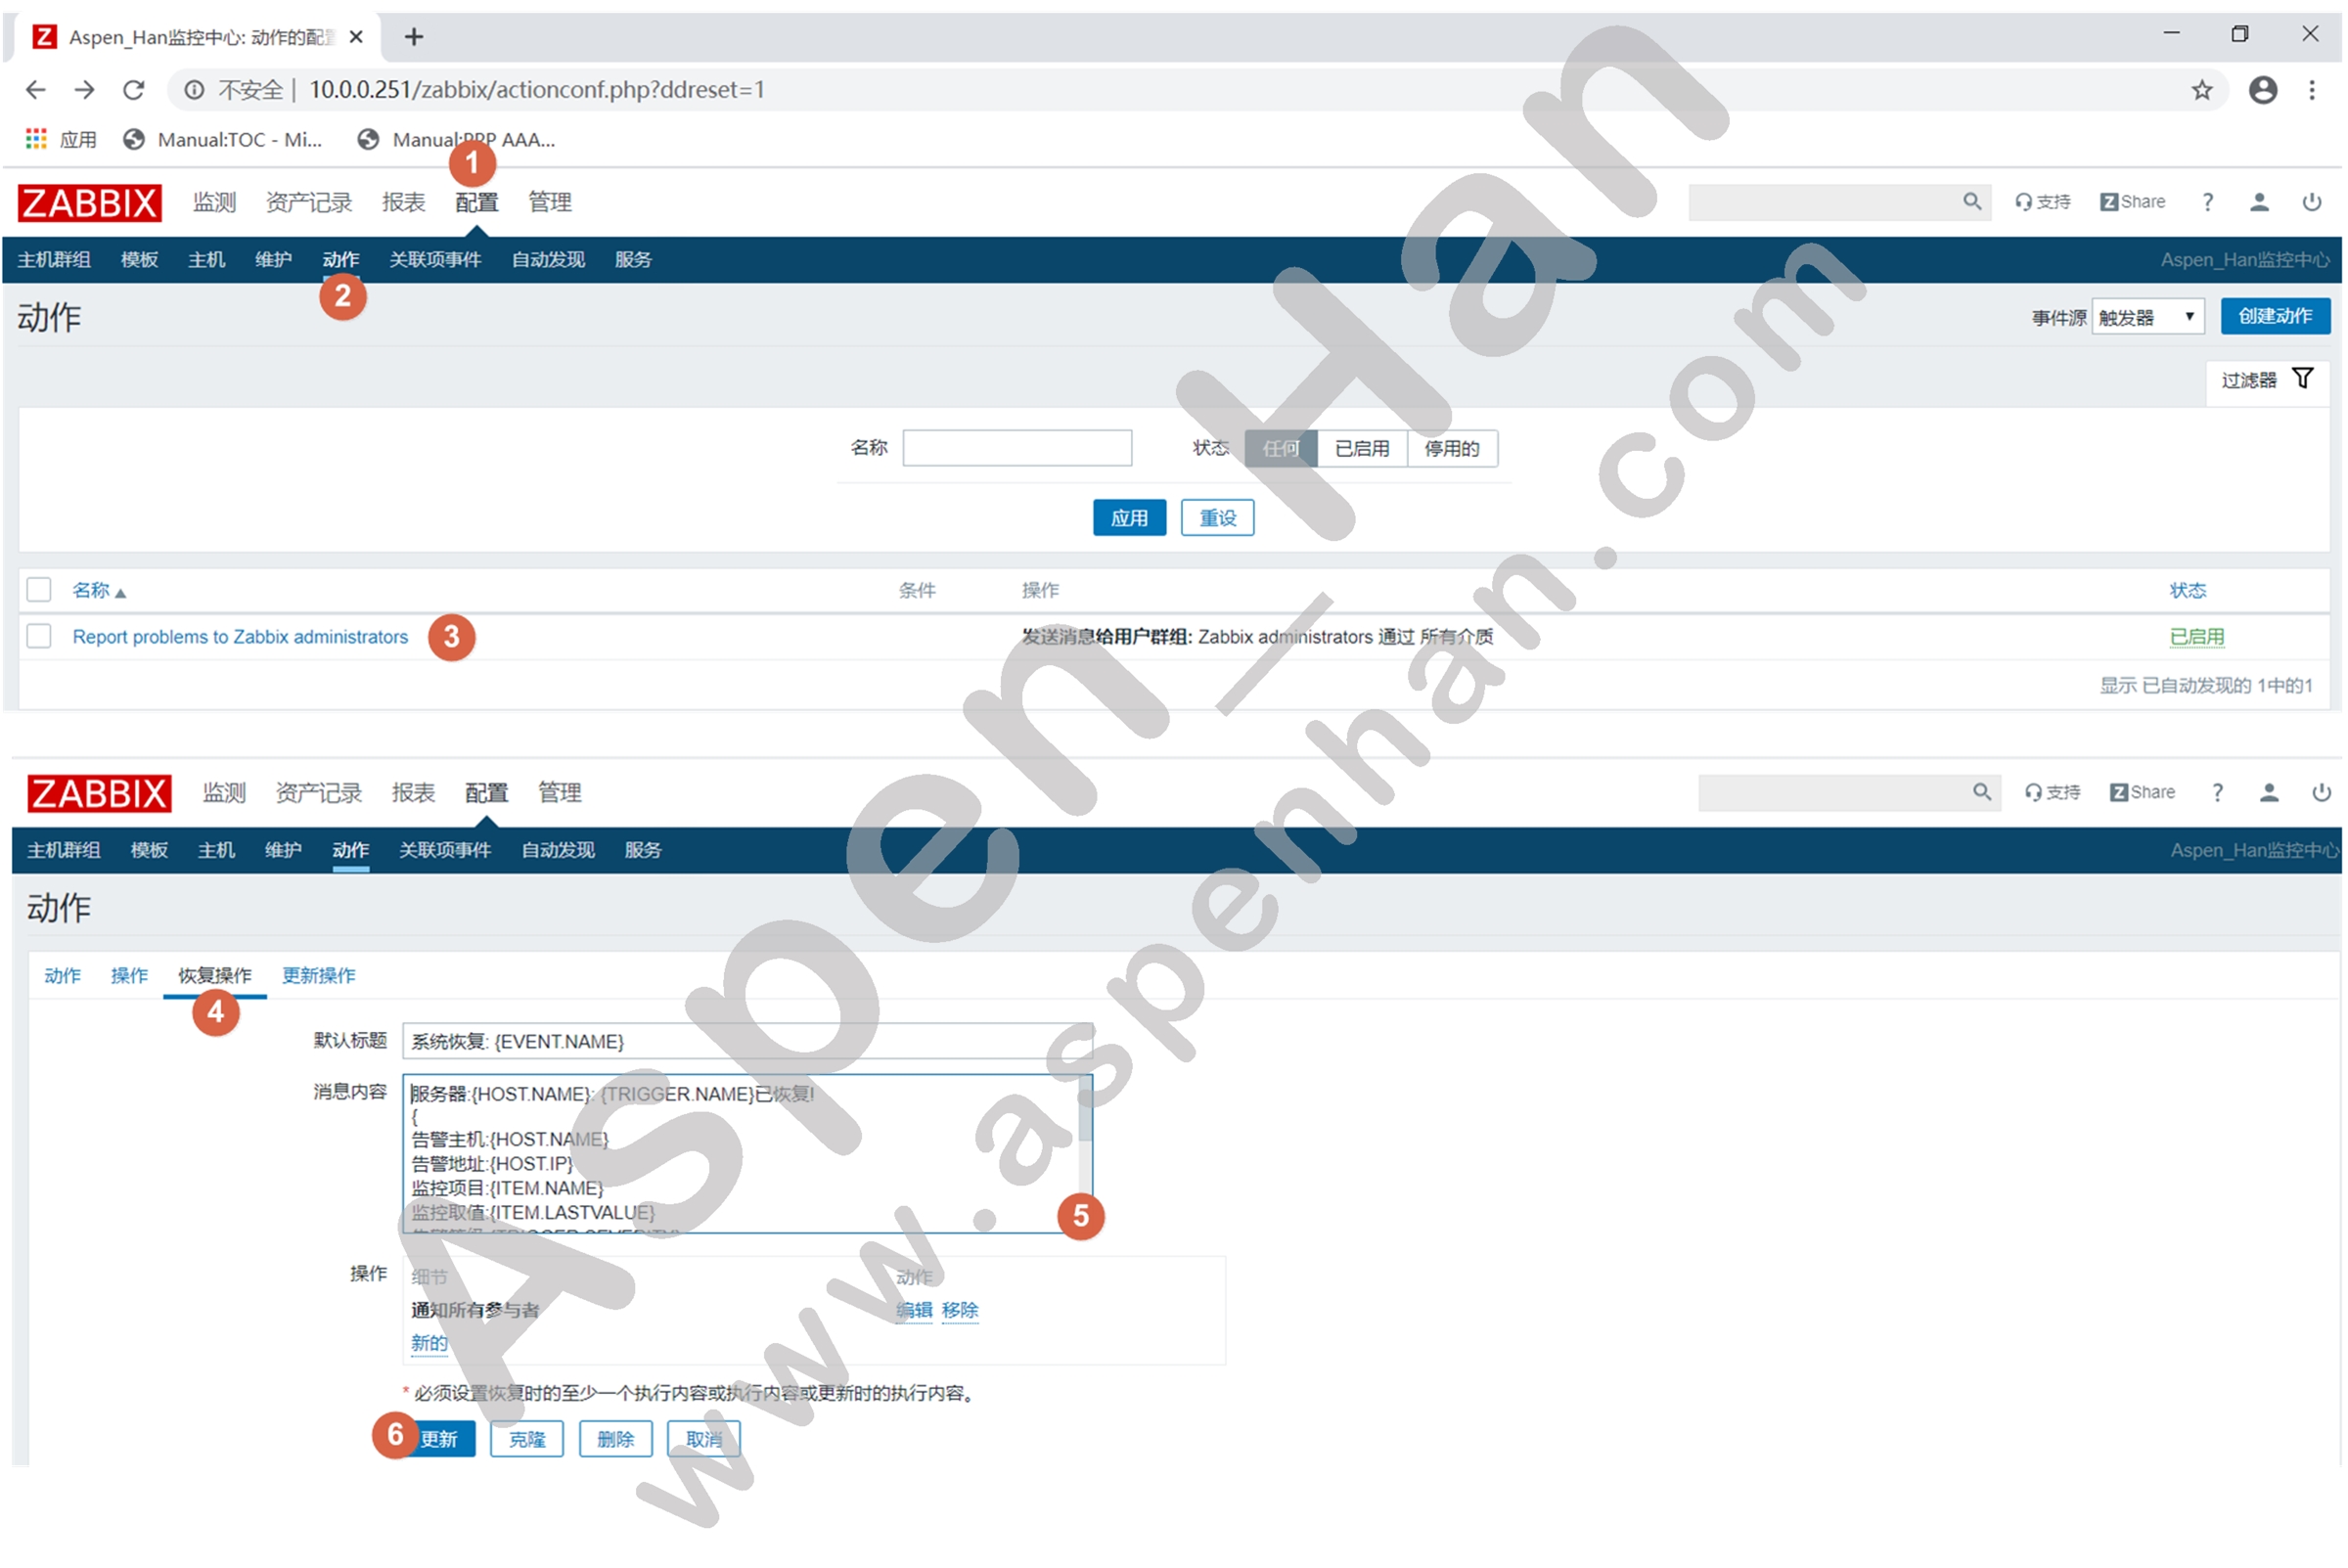
step 10 定制报警信息
| 配置 -> 动作 -> 特定动作 -> 操作 |
|
服务器:{HOST.NAME}发生: {TRIGGER.NAME}故障! { 告警主机:{HOST.NAME} 告警地址:{HOST.IP} 监控项目:{ITEM.NAME} 监控取值:{ITEM.LASTVALUE} 告警等级:{TRIGGER.SEVERITY} 当前状态:{TRIGGER.STATUS} 告警信息:{TRIGGER.NAME} 告警时间:{EVENT.DATE} {EVENT.TIME} 事件ID:{EVENT.ID} } |

|
服务器:{HOST.NAME}: {TRIGGER.NAME}已恢复! { 告警主机:{HOST.NAME} 告警地址:{HOST.IP} 监控项目:{ITEM.NAME} 监控取值:{ITEM.LASTVALUE} 告警等级:{TRIGGER.SEVERITY} 当前状态:{TRIGGER.STATUS} 告警信息:{TRIGGER.NAME} 告警时间:{EVENT.DATE} {EVENT.TIME} 恢复时间:{EVENT.RECOVERY.DATE} {EVENT.RECOVERY.TIME} 持续时间:{EVENT.AGE} 事件ID:{EVENT.ID} } |
step 11 确认动作状态
| 报表 -> 动作日志 |

四、自定义模板
|
模板用于为批量被监控主机添加监控项 Zabbix模版可以导入导出 |
1.现有模板添加监控项
step 1 定义监控项
|
#include=/etc/zabbix/zabbix_agentd.d/*.conf UserParameter=键名,取值命令 |
[root@zabbix-web /etc/zabbix/zabbix_agentd.d]# vim userparameter_disk.conf
UserParameter=root_usage,df -h | grep -w '/' | awk '{print $(NF-1)}'|tr -d '%'
step 2 重启Zabbix-Agent
| systemctl restart zabbix-agent |
[root@zabbix-web /etc/zabbix/zabbix_agentd.d]# systemctl restart zabbix-agent.servicestep 3 添加监控项(Web端)
| 配置 -> 主机 -> 指定主机 -> 监控项 -> 创建监控项 |
step 4 将监控项复制至模板
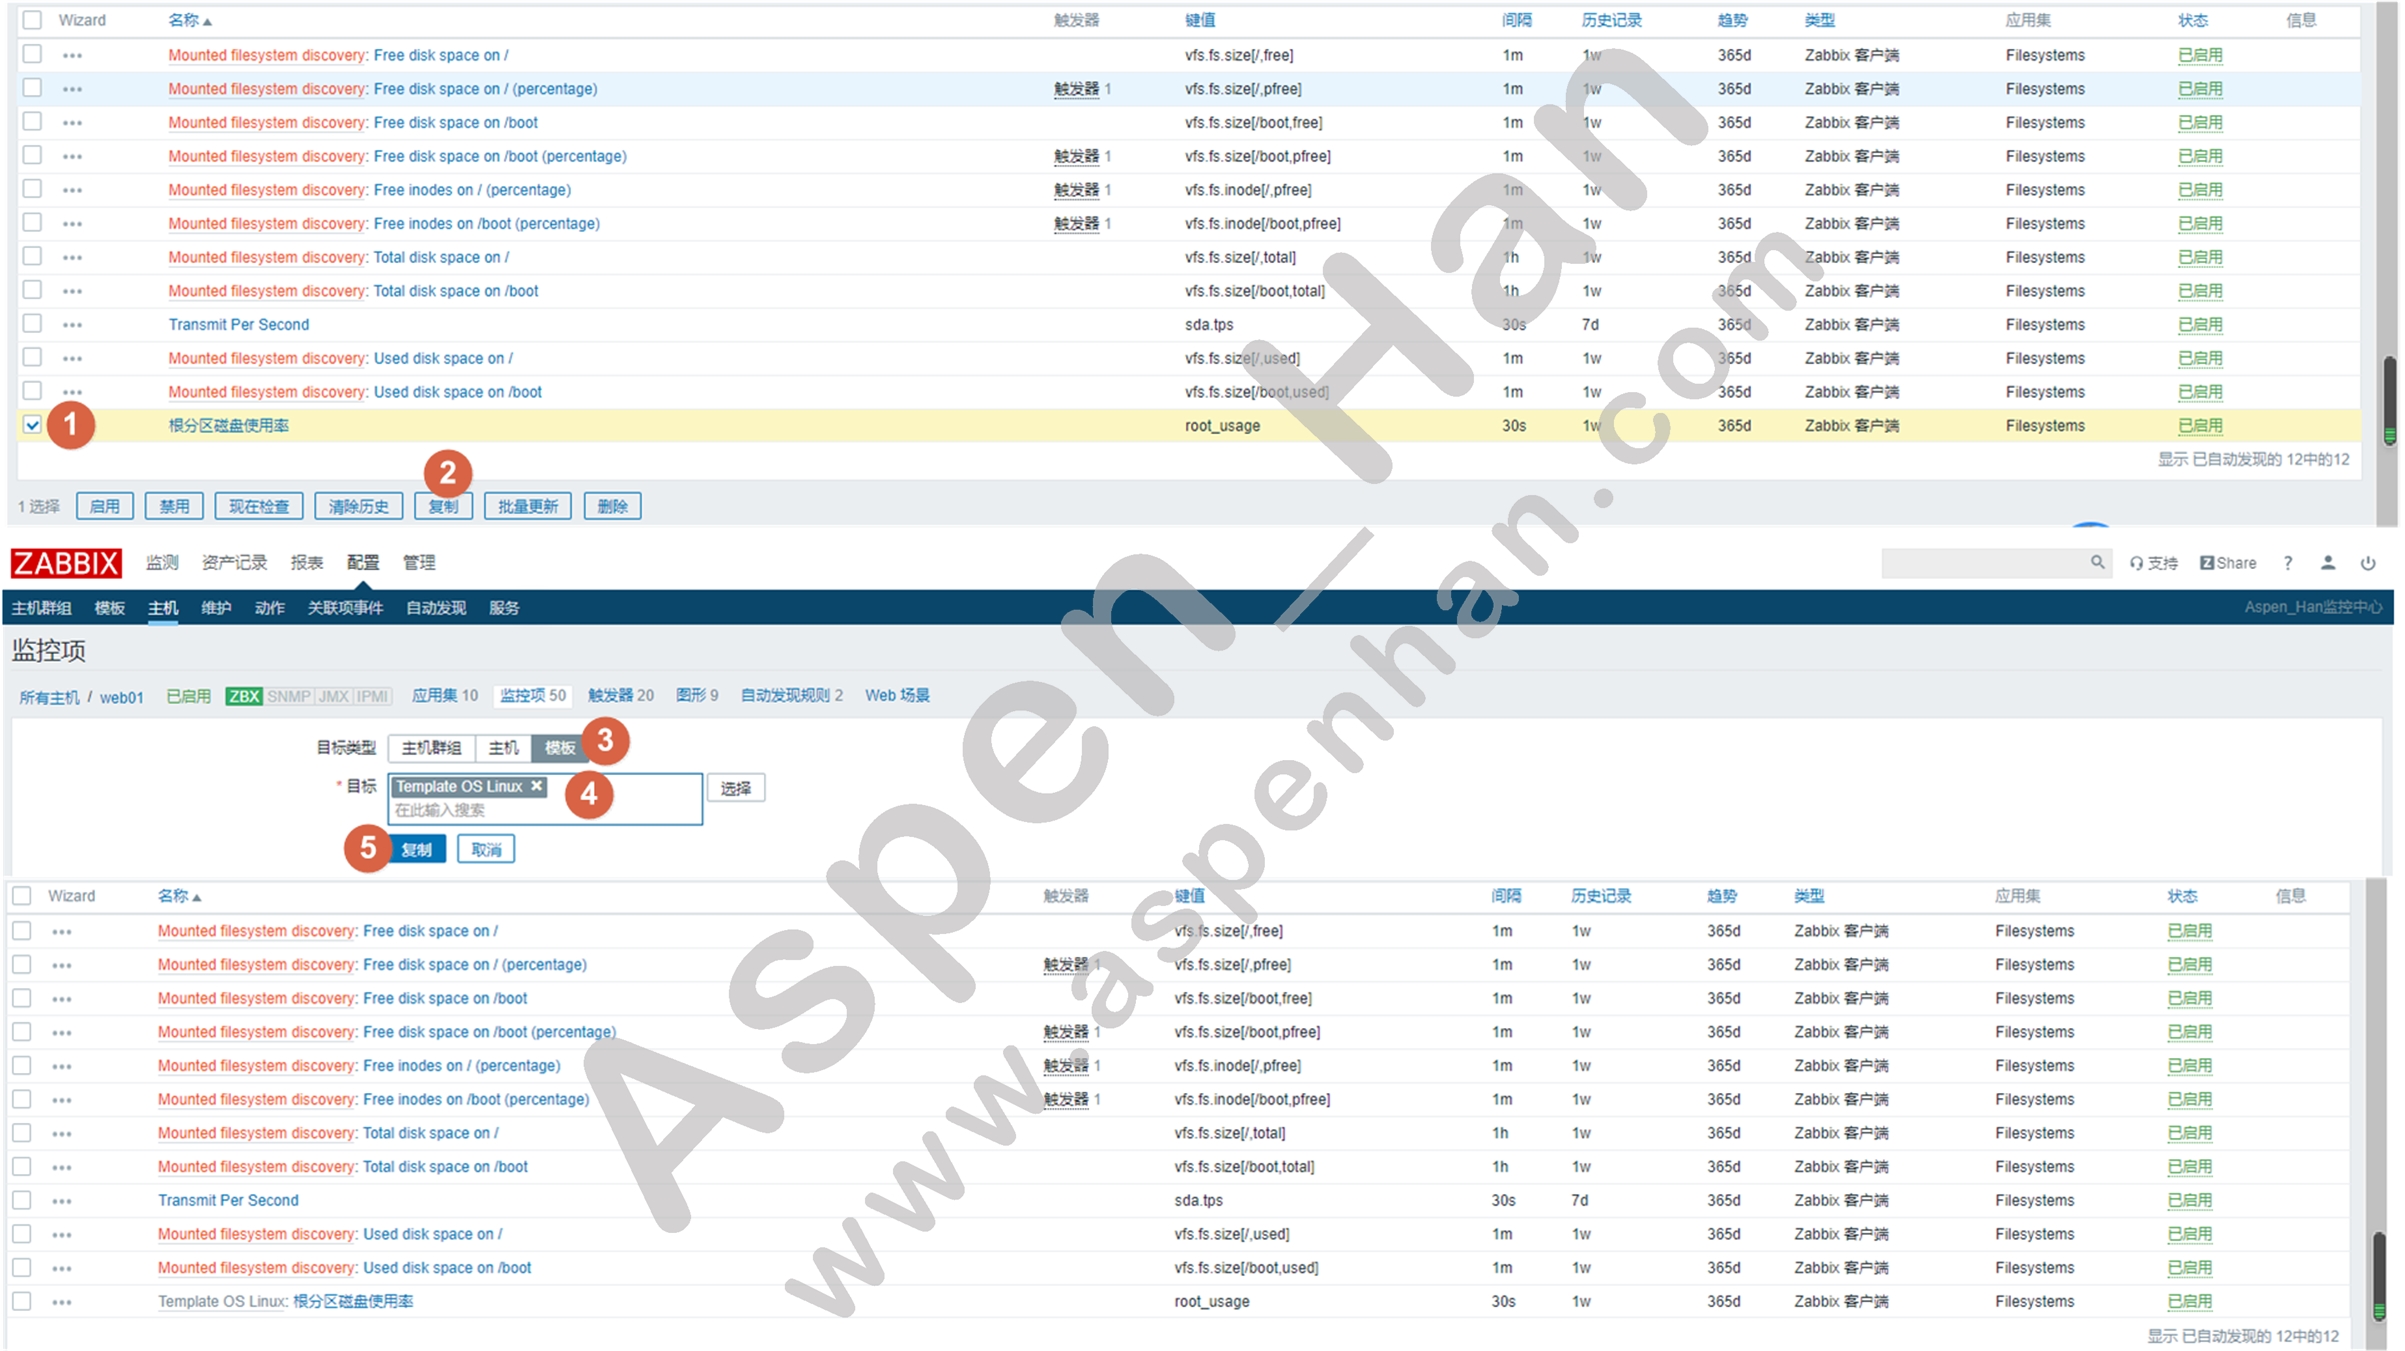
step 5 同步监控项至其他主机
| scp -rp /etc/zabbix/zabbix_agentd.d/*.conf IP地址:/etc/zabbix/zabbix_agentd.d/*.conf |
[root@zabbix-web /etc/zabbix/zabbix_agentd.d]# scp -rp userparameter_disk.conf 10.0.0.251:`pwd`/userparameter_disk.conf
The authenticity of host '10.0.0.251 (10.0.0.251)' can't be established.
ECDSA key fingerprint is SHA256:4O+/HRUt2Qwcz4xXk3y+Y5It07gqAUNy//ju/dZH2Vc.
ECDSA key fingerprint is MD5:5b:e2:99:8c:b6:d6:88:85:2c:4a:84:65:4a:74:78:75.
Are you sure you want to continue connecting (yes/no)? yes
Warning: Permanently added '10.0.0.251' (ECDSA) to the list of known hosts.
root@10.0.0.251's password:
userparameter_disk.conf                                               100%  134   174.5KB/s   00:00
[root@zabbix-server /etc/zabbix/zabbix_agentd.d]# ls
userparameter_disk.conf userparameter_mysql.conf
[root@zabbix-server /etc/zabbix/zabbix_agentd.d]# systemctl restart zabbix-agent.service step 6 同步被监控机环境
[root@zabbix-server /etc/zabbix/zabbix_agentd.d]# yum install -y sysstat-10.1.5-17.el7.x86_64
Loaded plugins: fastestmirror
Loading mirror speeds from cached hostfile
* base: mirrors.aliyun.com
* extras: mirrors.aliyun.com
* updates: mirrors.aliyun.com
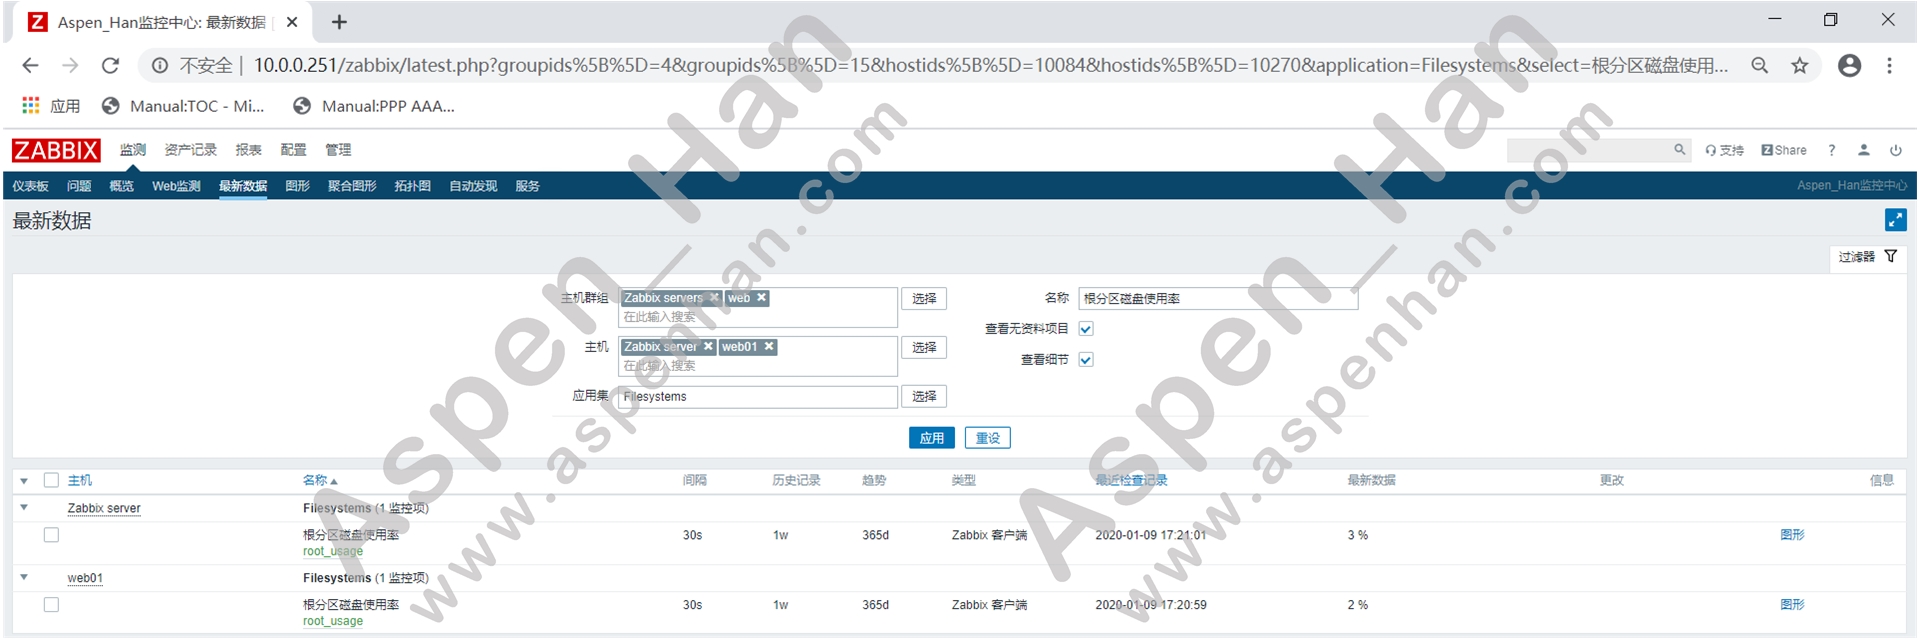
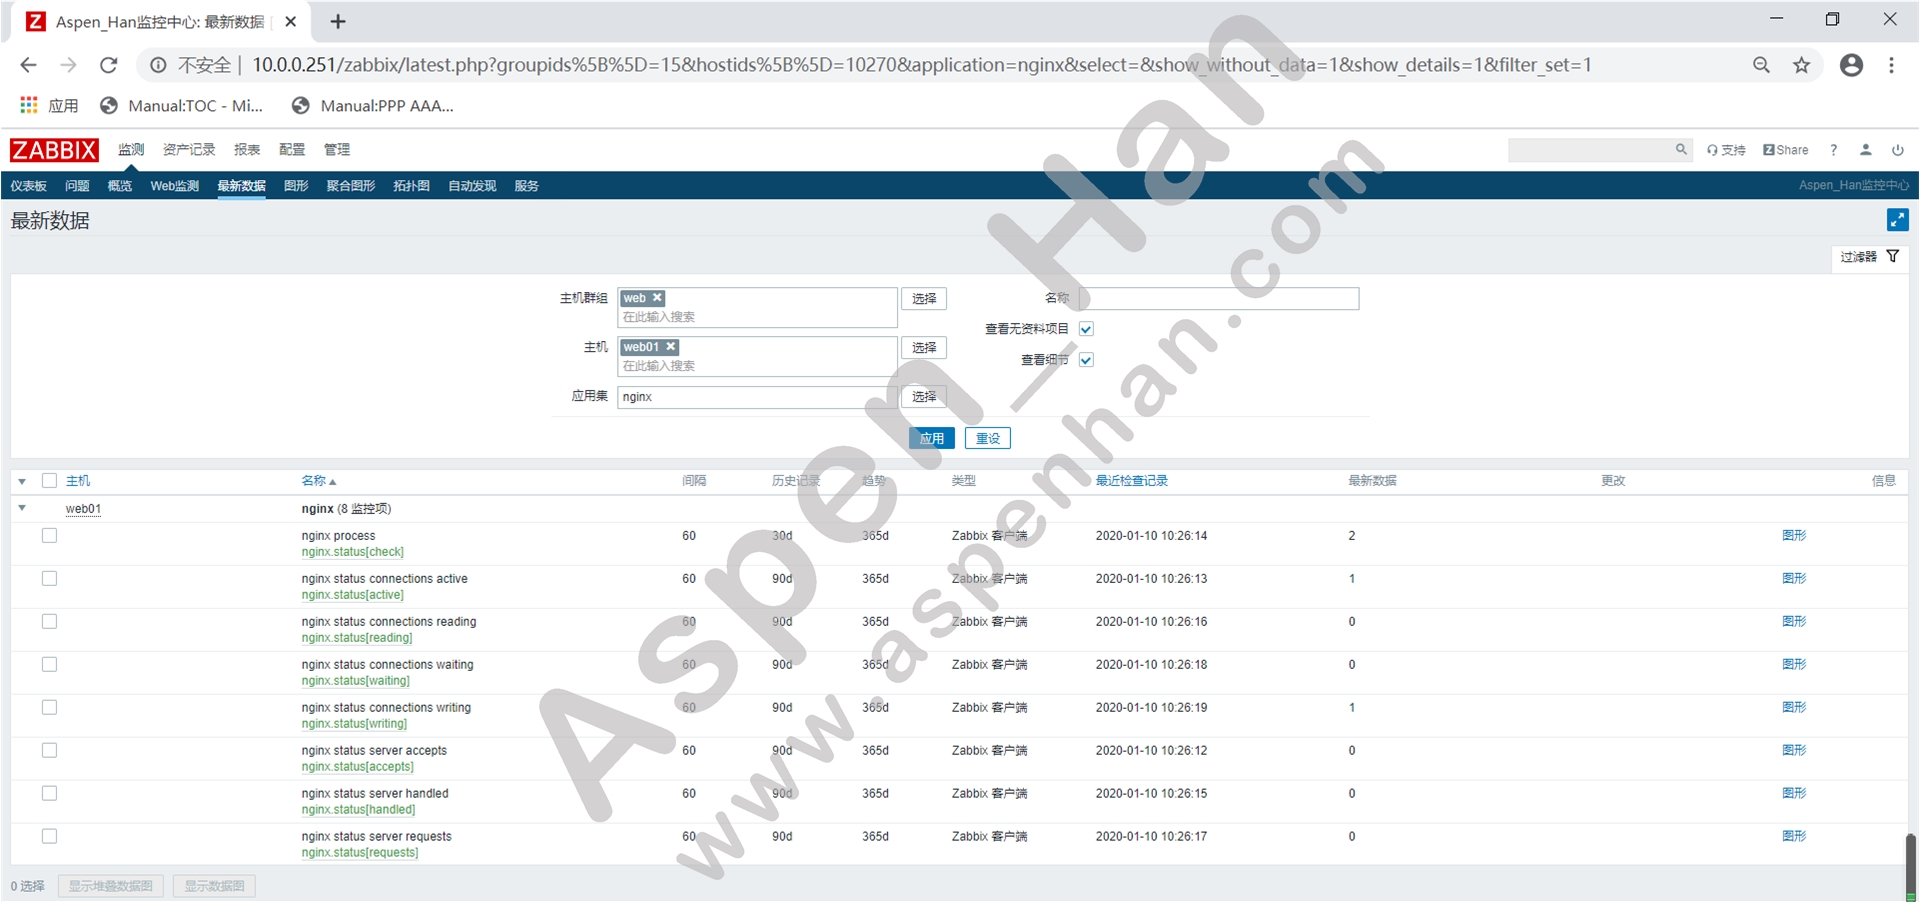
Nothing to dostep 7 确认监控状态
| 监测 -> 最新数据 -> 指定主机 -> 应用 |
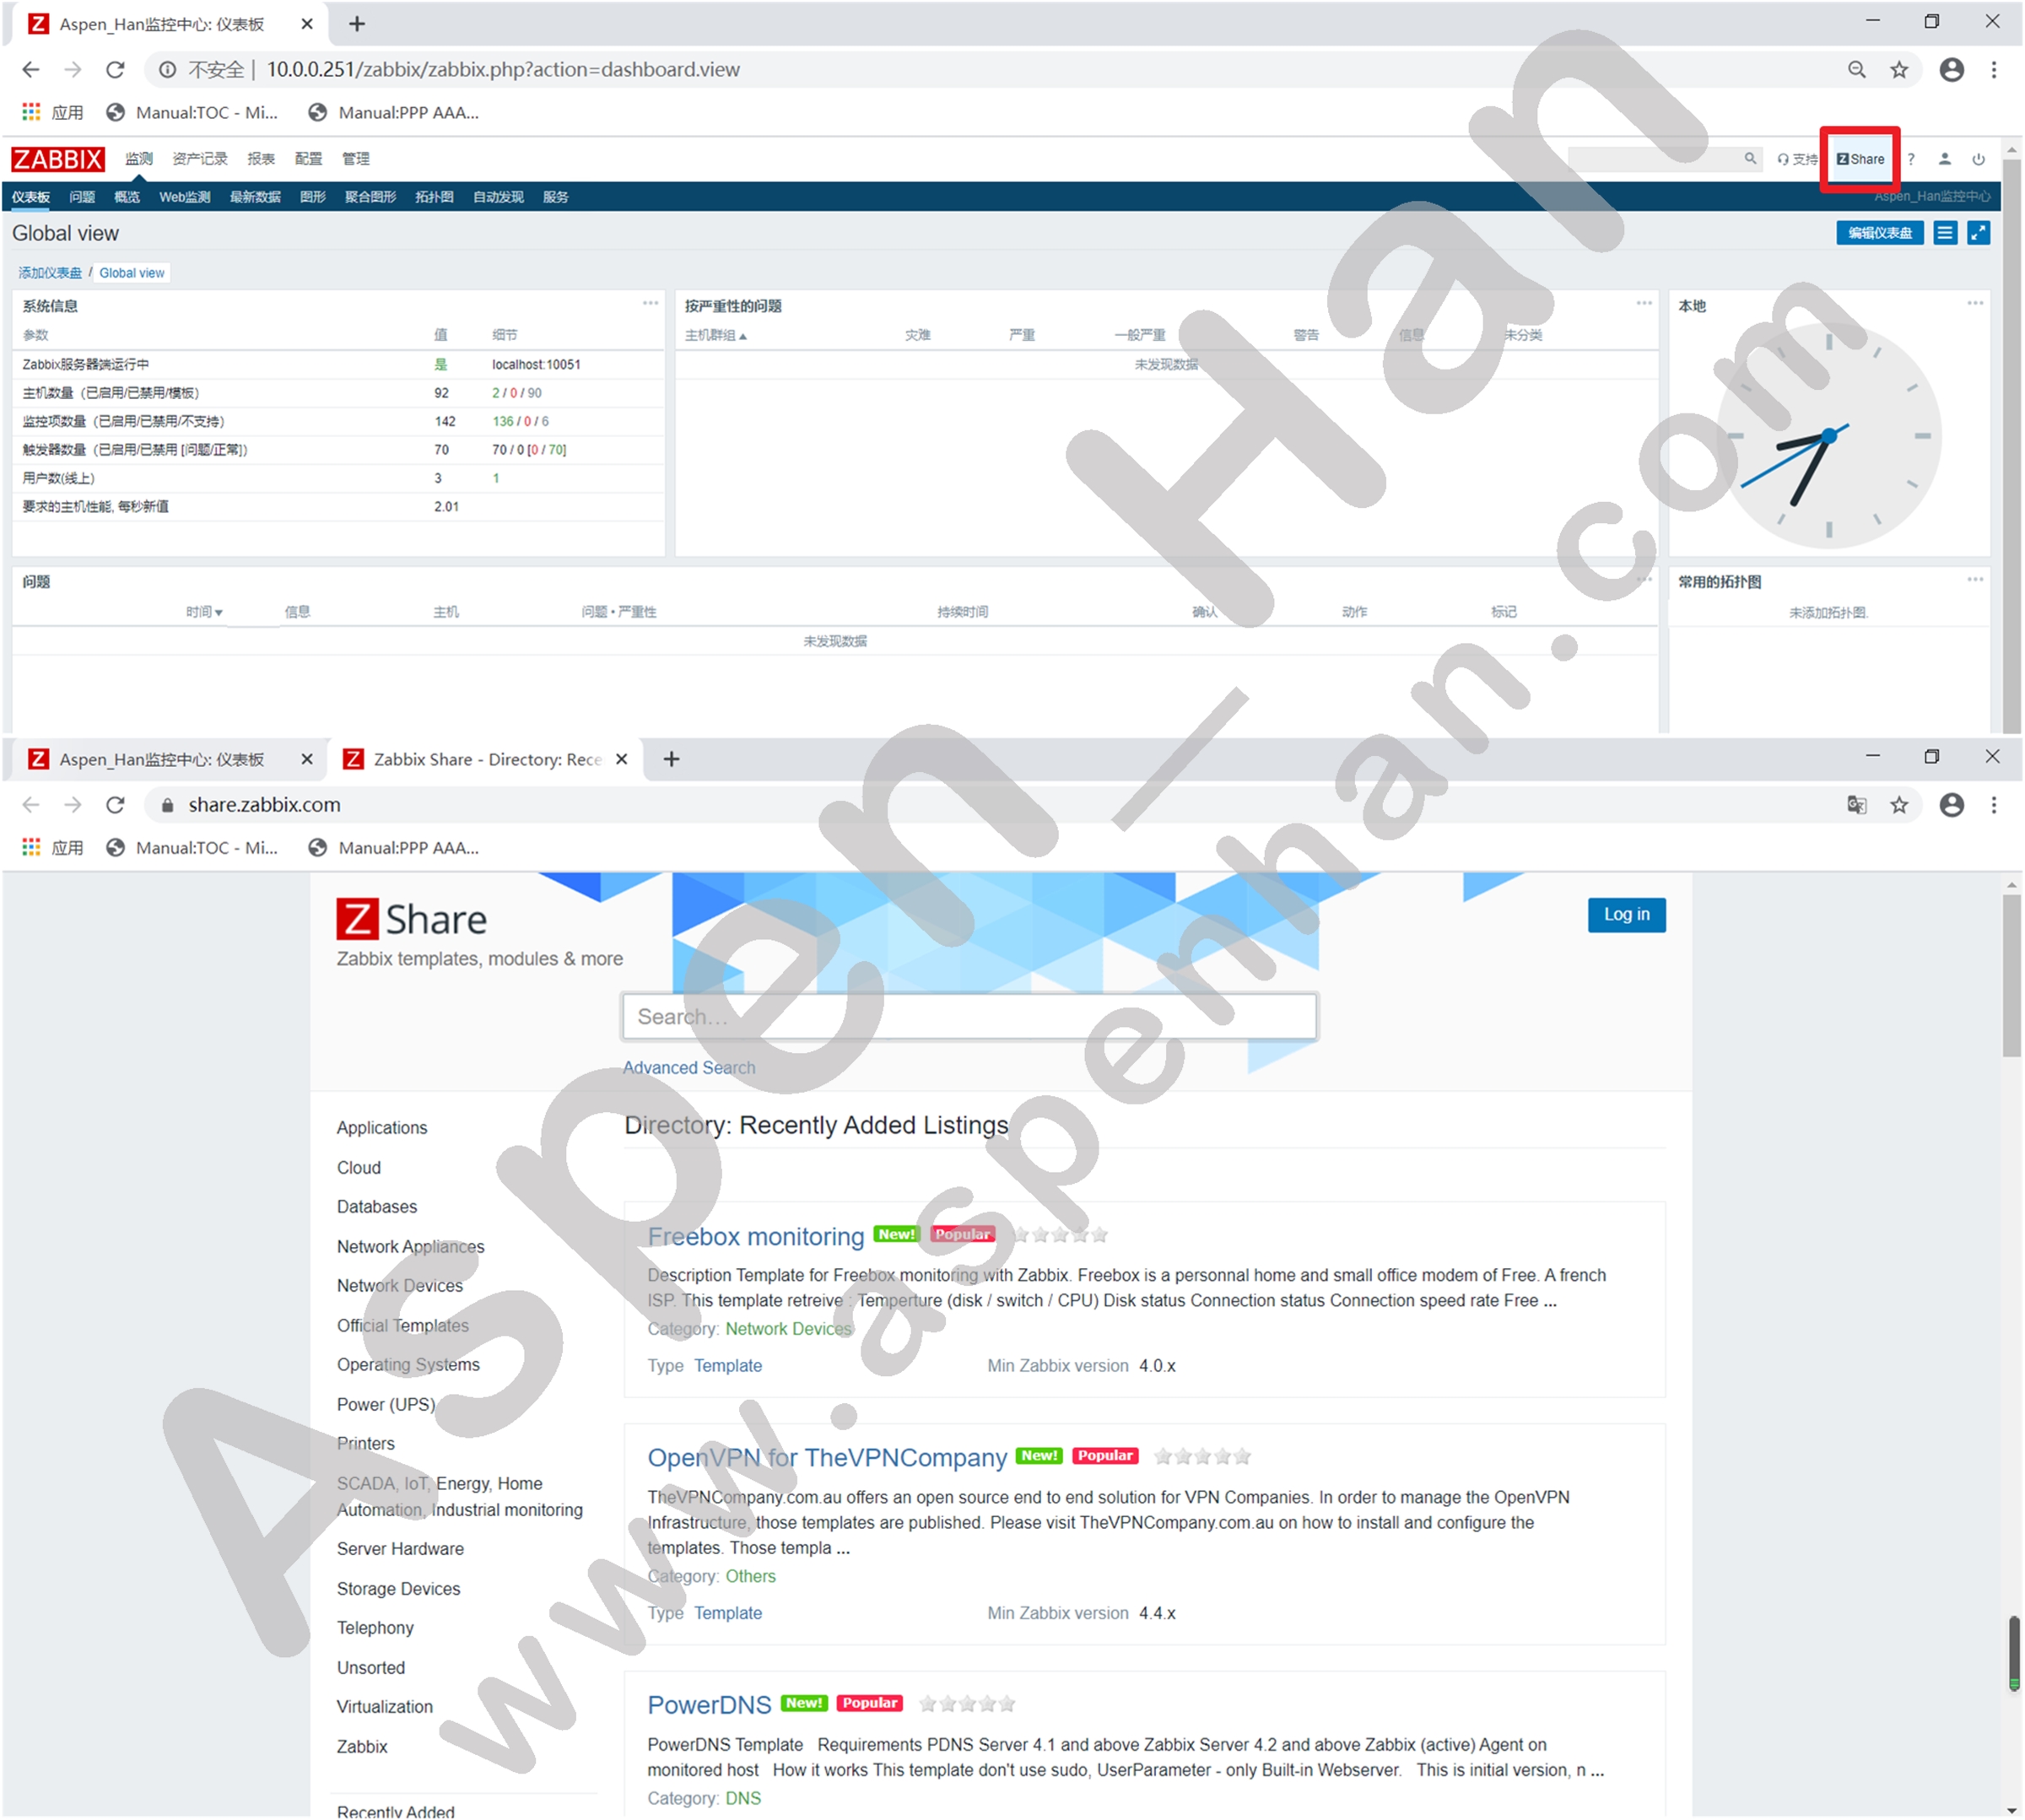
2. 导入模版
进入官方仓库
step 0 获取模板
[root@zabbix-web ~]# cd /tmp/
[root@zabbix-web /tmp]# git clone https://github.com/oscm/zabbix.git
Cloning into 'zabbix'...
remote: Enumerating objects: 317, done.
remote: Total 317 (delta 0), reused 0 (delta 0), pack-reused 317
Receiving objects: 100% (317/317), 5.89 MiB | 1.56 MiB/s, done.
Resolving deltas: 100% (144/144), done.
[root@zabbix-web /tmp]# ls
zabbix zabbix-agent-4.0.9-3.el7.x86_64.rpm
[root@zabbix-web /tmp]# cd zabbix/
[root@zabbix-web /tmp/zabbix]# ls
Dependency LICENSE Mototrbo Oracle postfix redis
elasticsearch mongodb nginx php-fpm README.md tcpstats
[root@zabbix-web /tmp/zabbix]# cd nginx/
[root@zabbix-web /tmp/zabbix/nginx]# ls
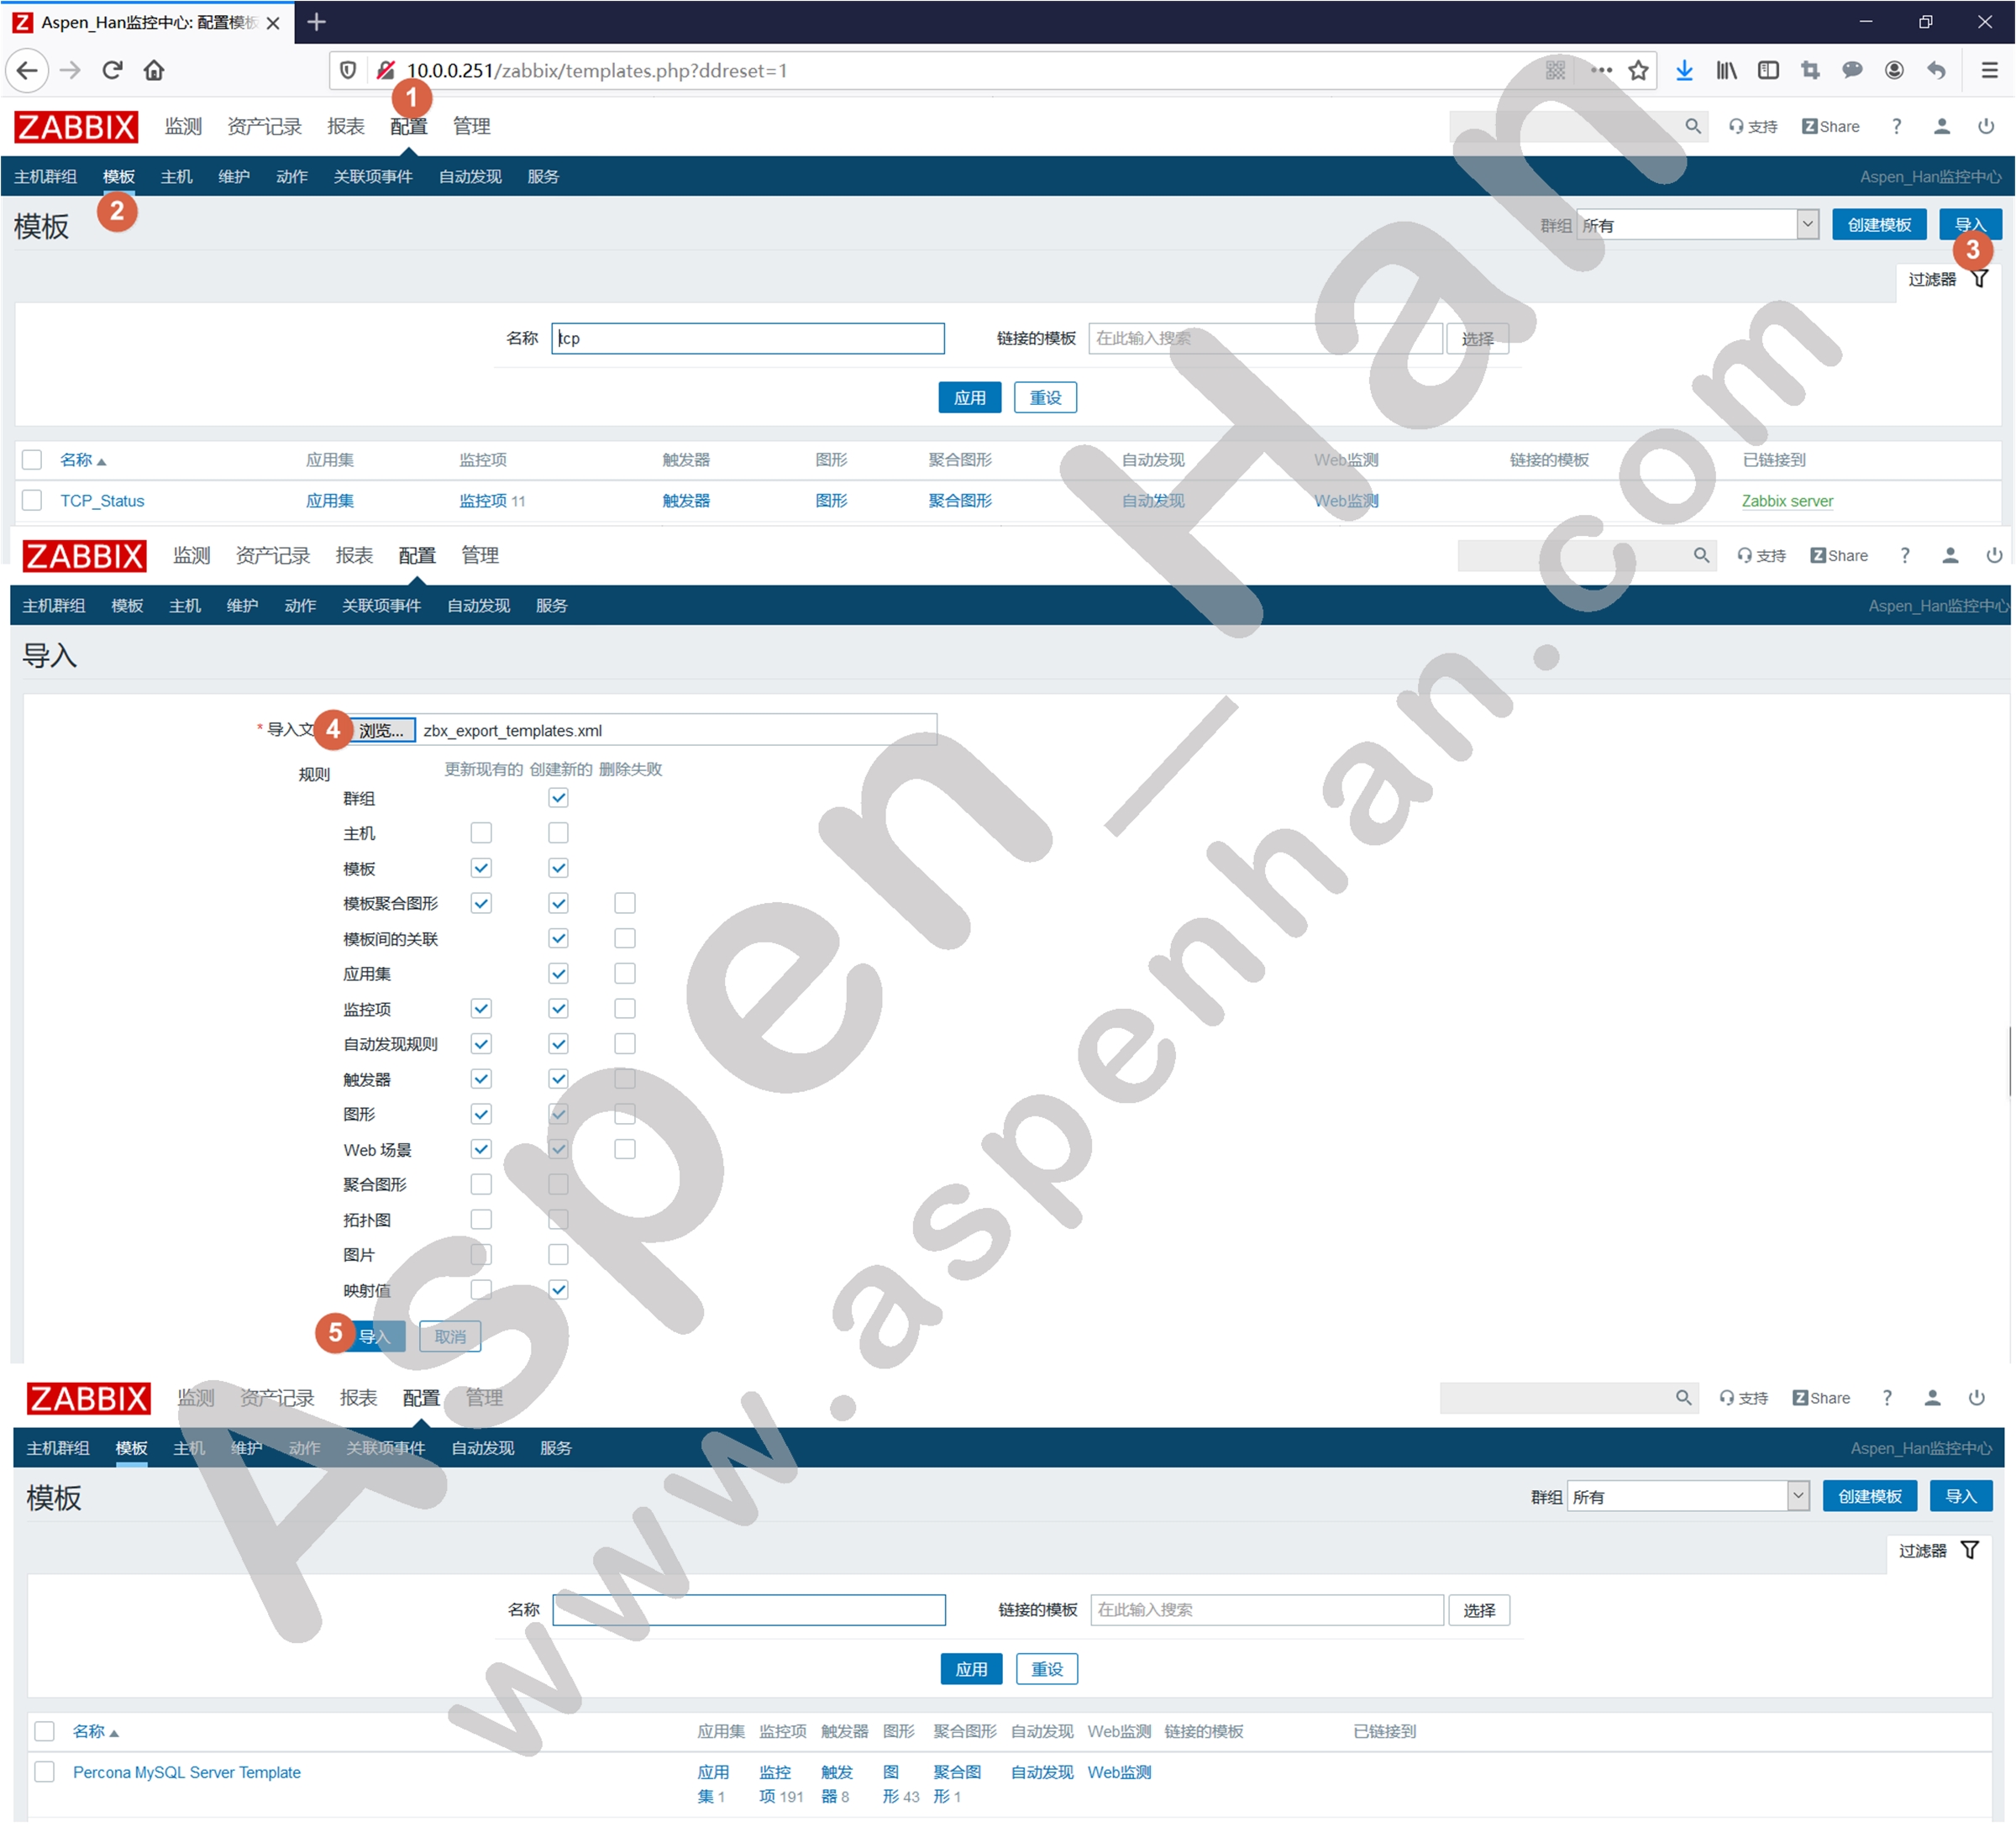
default.conf nginx.sh README.md userparameter_nginx.conf zbx_export_templates.xmlstep 1 导入模板
不能导入已存在的模板
| 配置 -> 模板 -> 导入 |
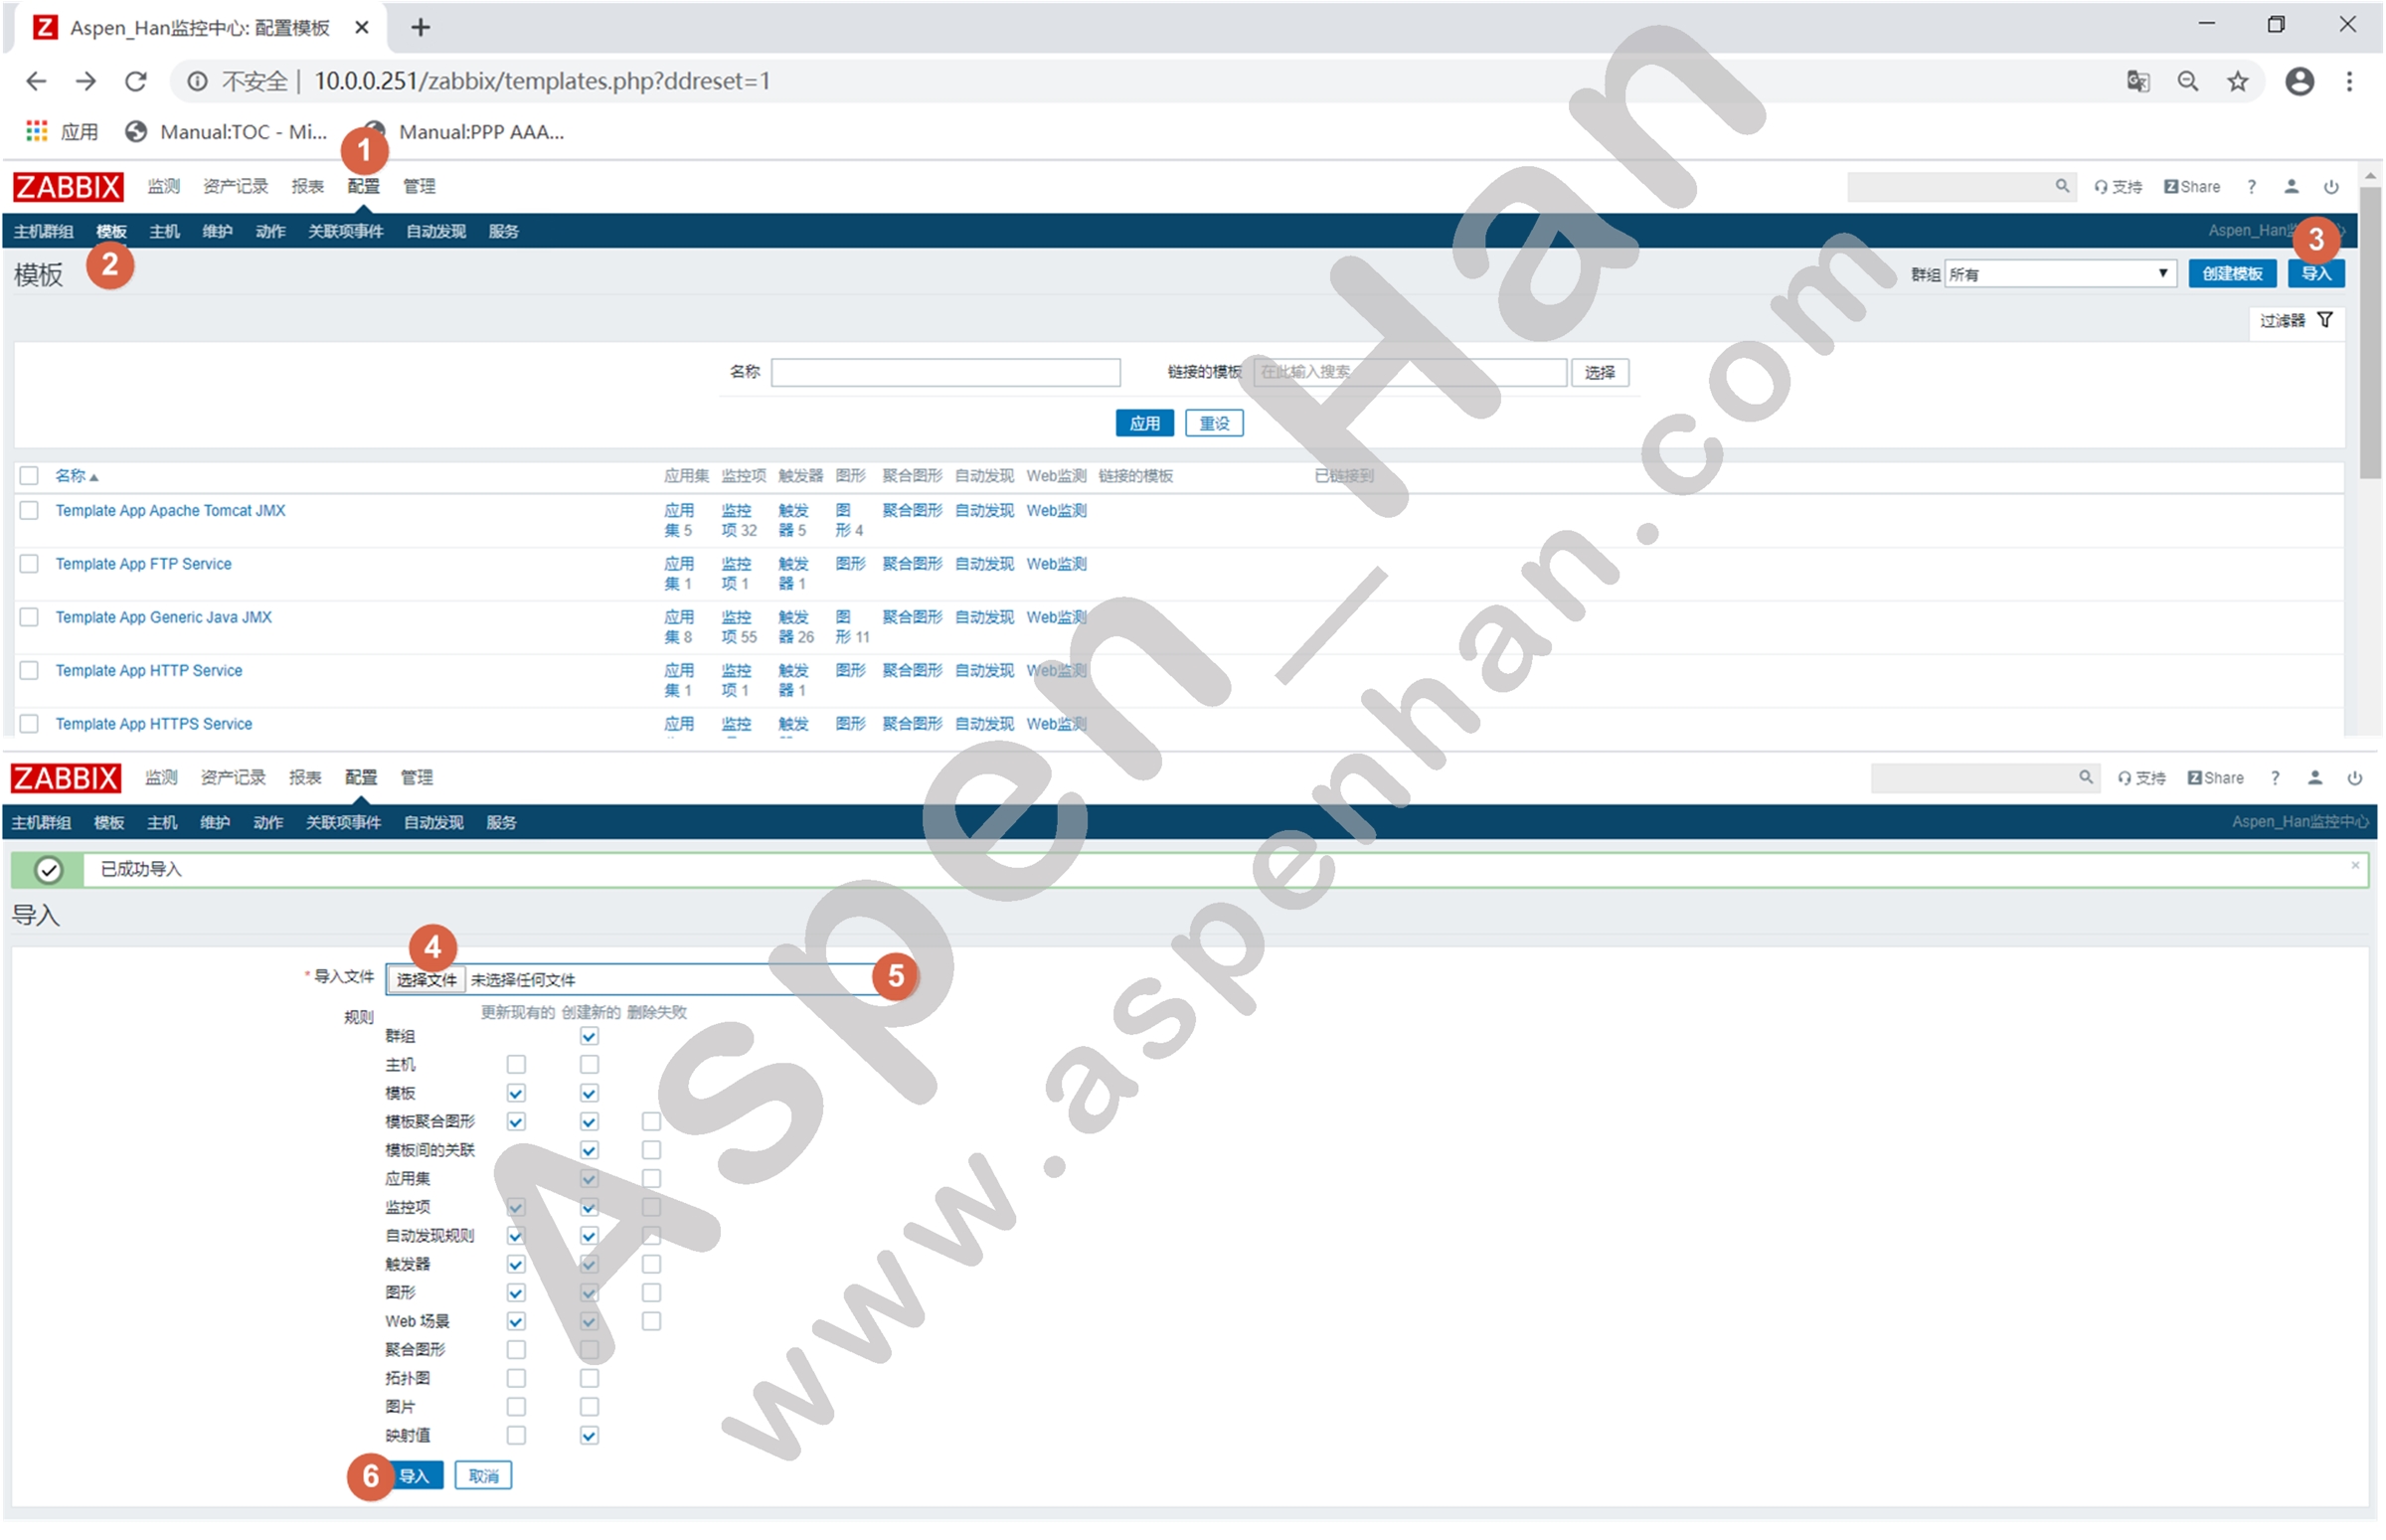
step 2 检查并导入监控项文件
[root@zabbix-web /tmp/zabbix/nginx]# sed -i s#/etc/zabbix#/server#g userparameter_nginx.conf
[root@zabbix-web /tmp/zabbix/nginx]# cat userparameter_nginx.conf
...
UserParameter=nginx.status[*],/server/scripts/nginx.sh $1
[root@zabbix-web /tmp/zabbix/nginx]# mv userparameter_nginx.conf /etc/zabbix/zabbix_agentd.d/
[root@zabbix-web /tmp/zabbix/nginx]# cd /etc/zabbix/zabbix_agentd.d/
[root@zabbix-web /etc/zabbix/zabbix_agentd.d]# ls
userparameter_disk.conf  userparameter_mysql.conf  userparameter_nginx.conf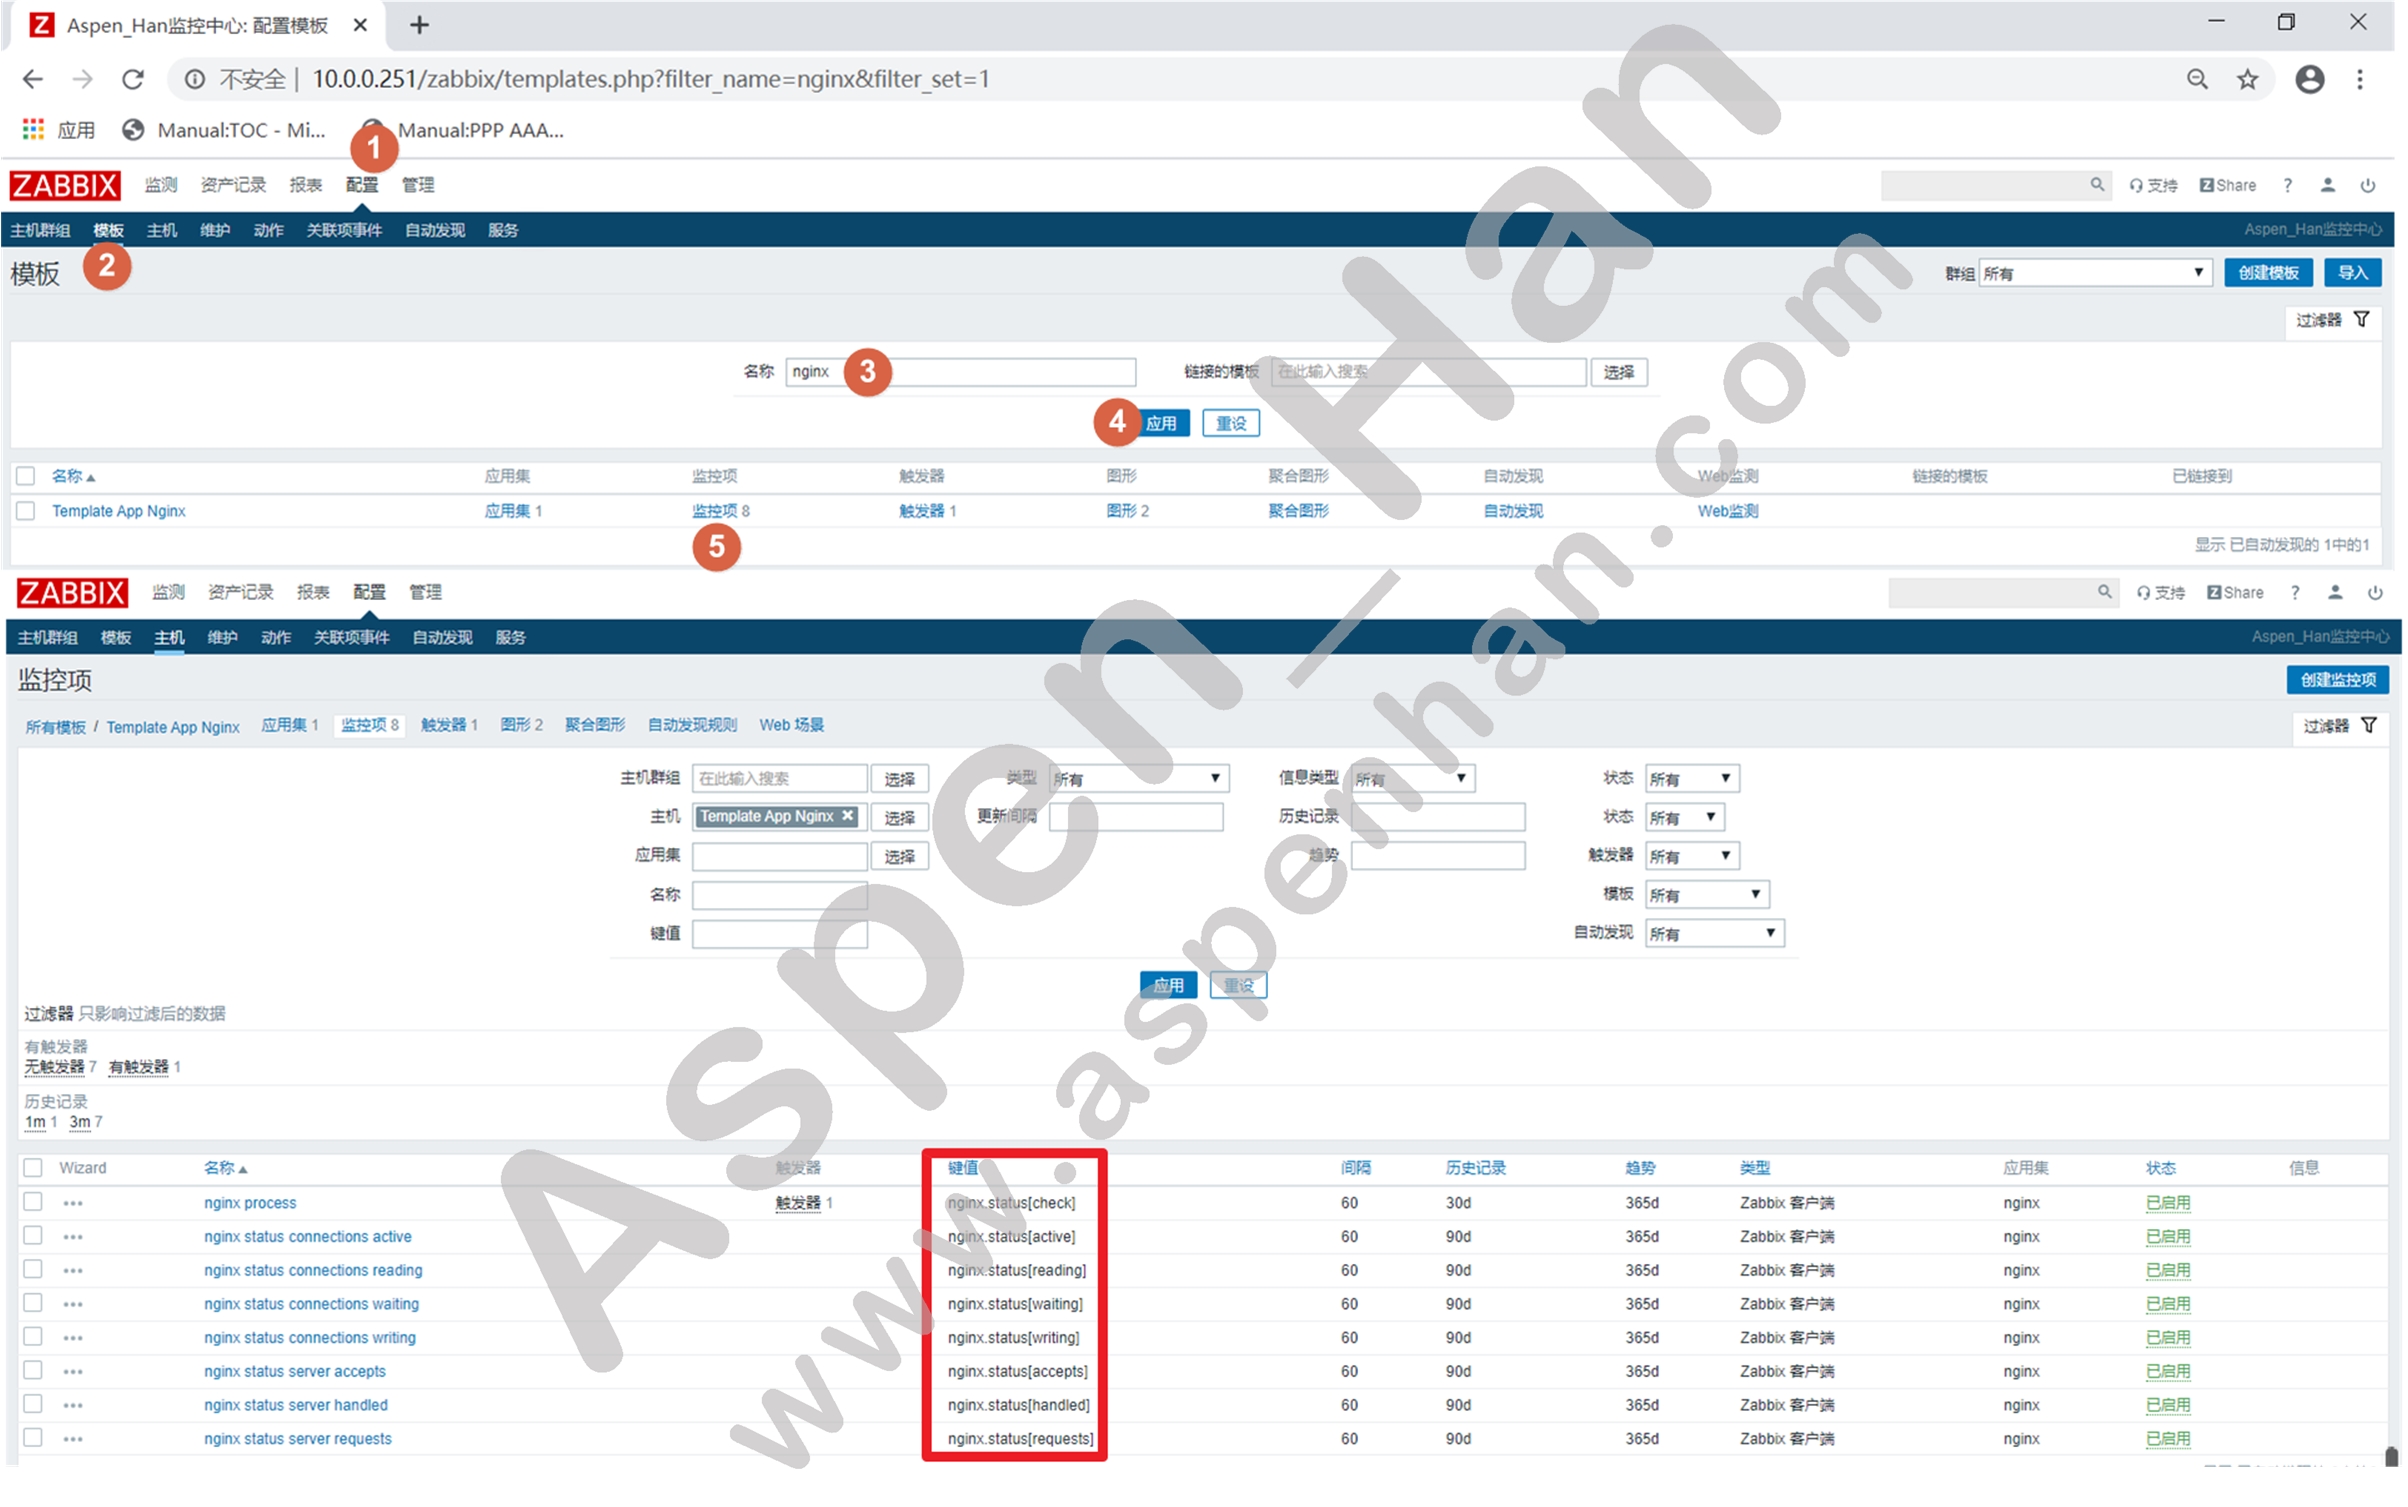
step 3 重启Zabbix-Agent
| systemctl restart zabbix-agent |
[root@zabbix-web /etc/zabbix/zabbix_agentd.d]# systemctl restart zabbix-agent.service step 4 获取监控值
本文以上传取值脚本为例
[root@zabbix-web /tmp/zabbix/nginx]# mv nginx.sh /server/scripts/
[root@zabbix-web /tmp/zabbix/nginx]# cd /server/scripts/
[root@zabbix-web /server/scripts]# ll
total 4
-rw-r--r-- 1 root root 1649 Jan 10 08:42 nginx.sh
[root@zabbix-web /server/scripts]# ll
total 4
-rwxr-xr-x 1 root root 1649 Jan 10 08:42 nginx.sh
[root@zabbix-web /server/scripts]# ./nginx.sh check
0
step 5 其他
[root@zabbix-web /server/scripts]# vim /etc/yum.repos.d/nginx.repo
[nginx-stable]
name=nginx stable repo
baseurl=http://nginx.org/packages/centos/$releasever/$basearch/
gpgcheck=0
enabled=1
gpgkey=https://nginx.org/keys/nginx_signing.key
[root@zabbix-web /server/scripts]# yum install -y nginx
Loaded plugins: fastestmirror
Loading mirror speeds from cached hostfile
...
Installed:
  nginx.x86_64 1:1.16.1-1.el7.ngx

Complete!
[root@zabbix-web /server/scripts]# cd /etc/nginx/conf.d/
[root@zabbix-web /etc/nginx/conf.d]# vim status.conf
server {
    listen 80;
    location /stub_status {
        stub_status on;
        access_log off;
    }
}
[root@zabbix-web /etc/nginx/conf.d]# mv default.conf default.conf.bak
[root@zabbix-web /etc/nginx/conf.d]# ls
default.conf.bak  status.conf
[root@zabbix-web /etc/nginx/conf.d]# nginx -t
nginx: the configuration file /etc/nginx/nginx.conf syntax is ok
nginx: configuration file /etc/nginx/nginx.conf test is successful
[root@zabbix-web /etc/nginx/conf.d]# systemctl restart nginx
[root@zabbix-web /etc/nginx/conf.d]# curl -s "http://localhost:80/stub_status/"
Active connections: 1
server accepts handled requests
 1 1 1
Reading: 0 Writing: 1 Waiting: 0
step 6 手动测试监控项(Server端)
| zabbix_get -s IP地址 -k 监控项 |
[root@zabbix-server ~]# yum install -y zabbix-get.x86_64
Loaded plugins: fastestmirror
Loading mirror speeds from cached hostfile
...
Installed:
zabbix-get.x86_64 0:4.0.16-1.el7
Complete!
[root@zabbix-server /server/scripts]# zabbix_get -s 10.0.0.252 -k nginx.status[check]
2
[root@zabbix-server /server/scripts]# zabbix_get -s 10.0.0.252 -k nginx.status[active]
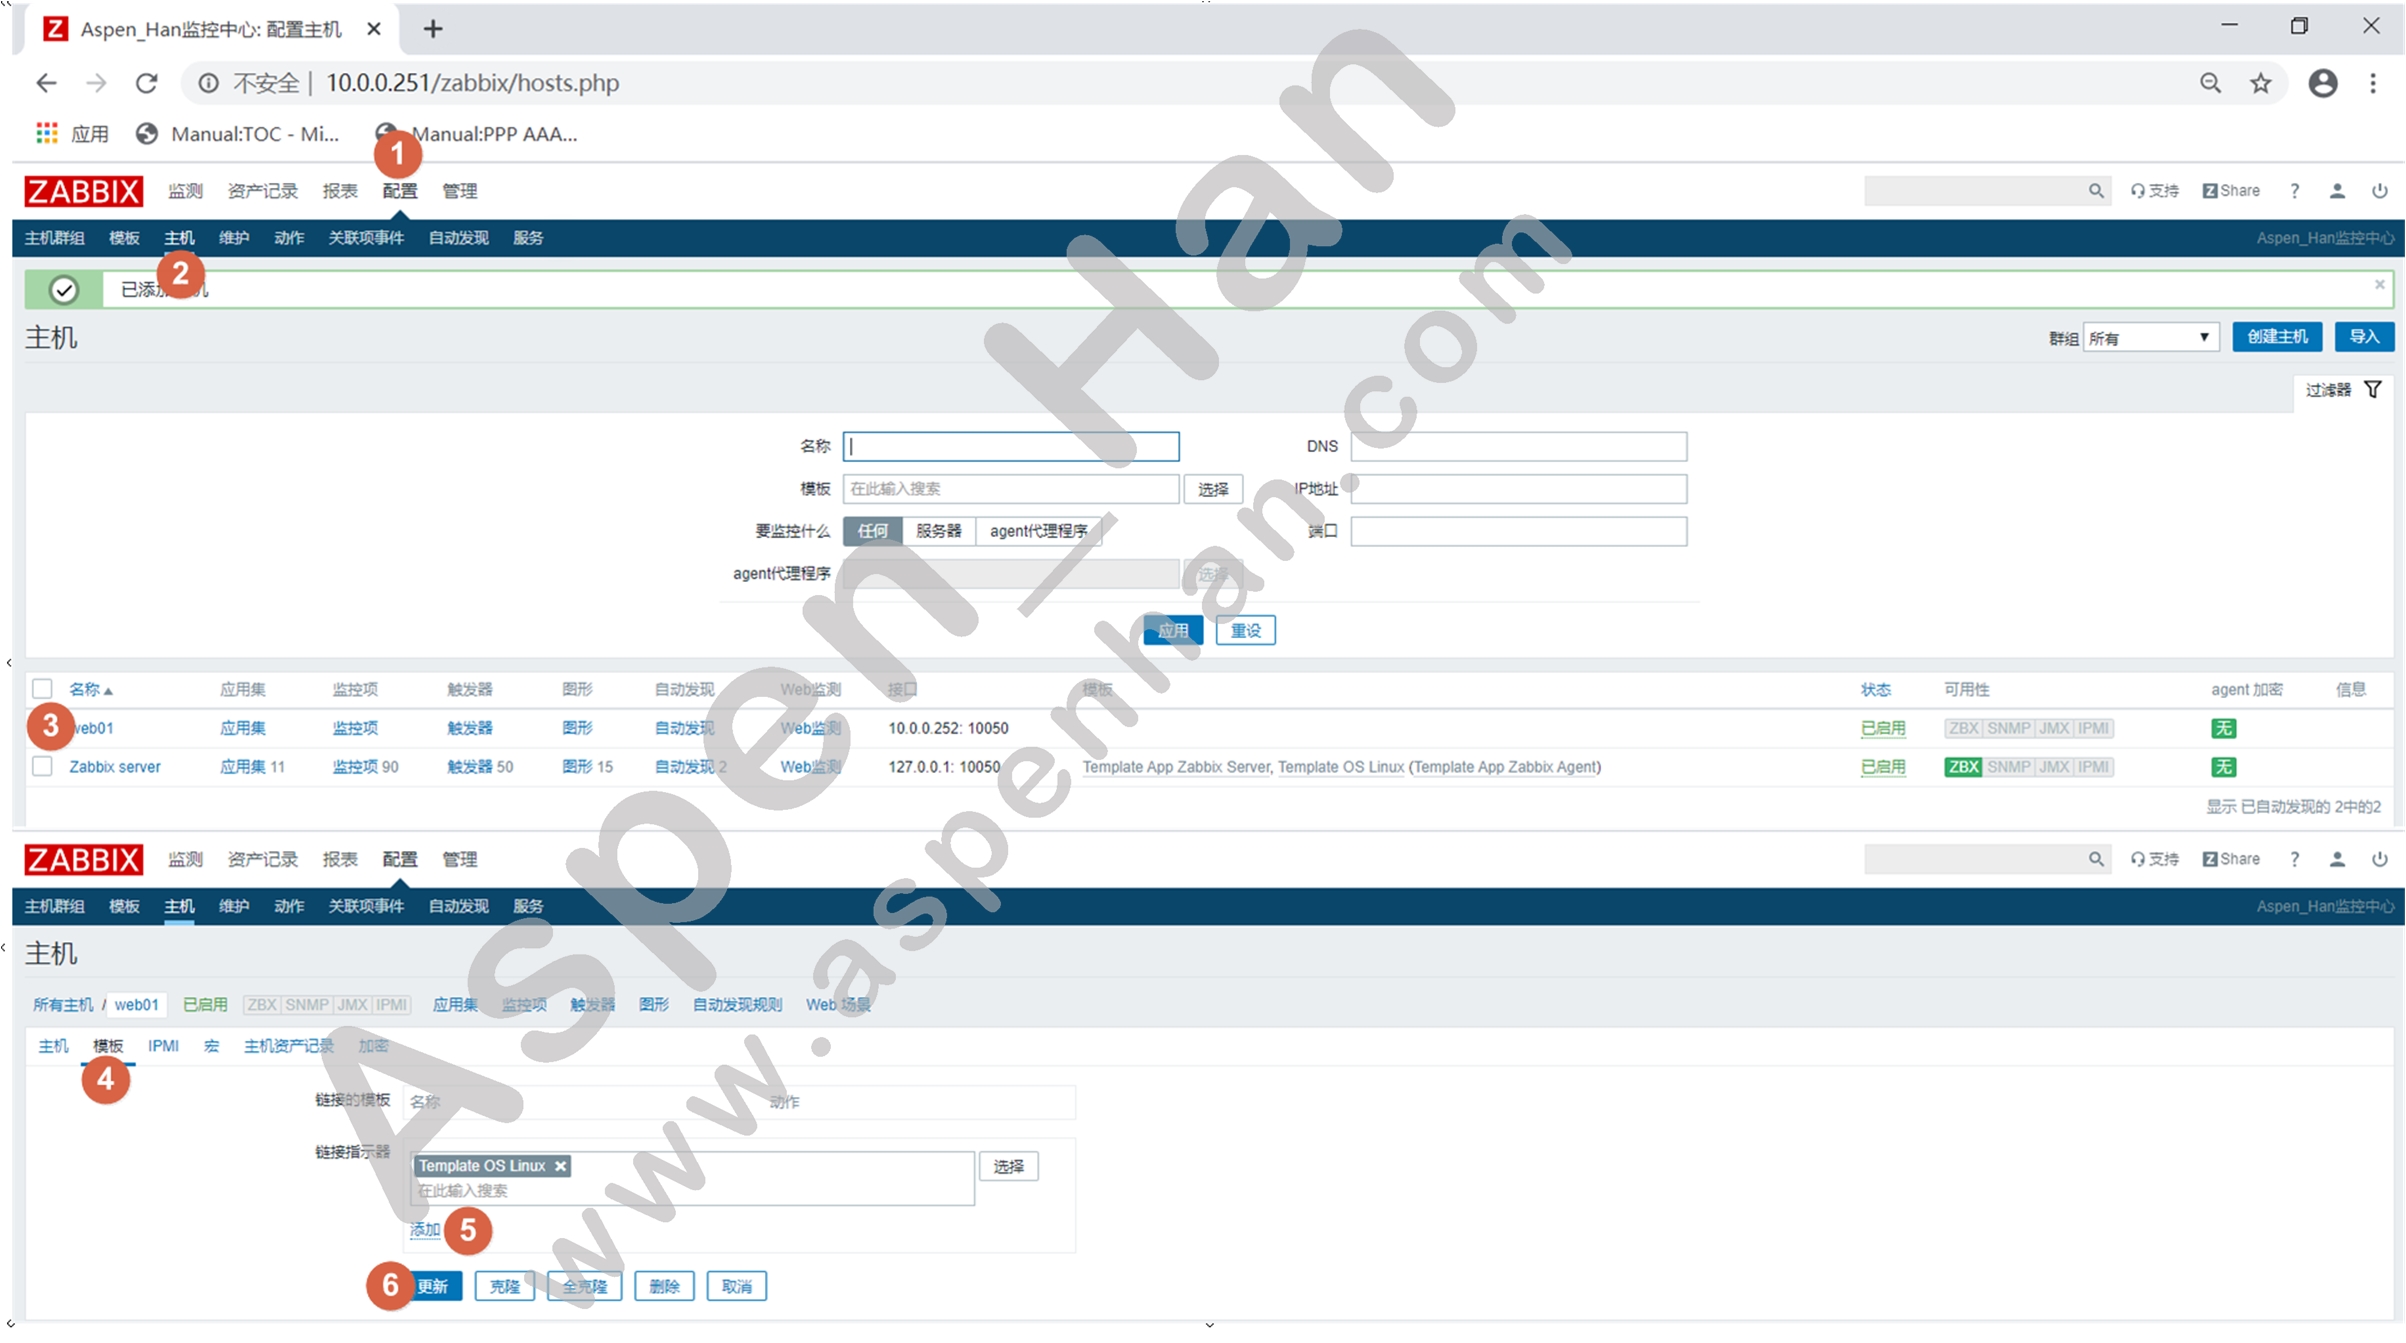
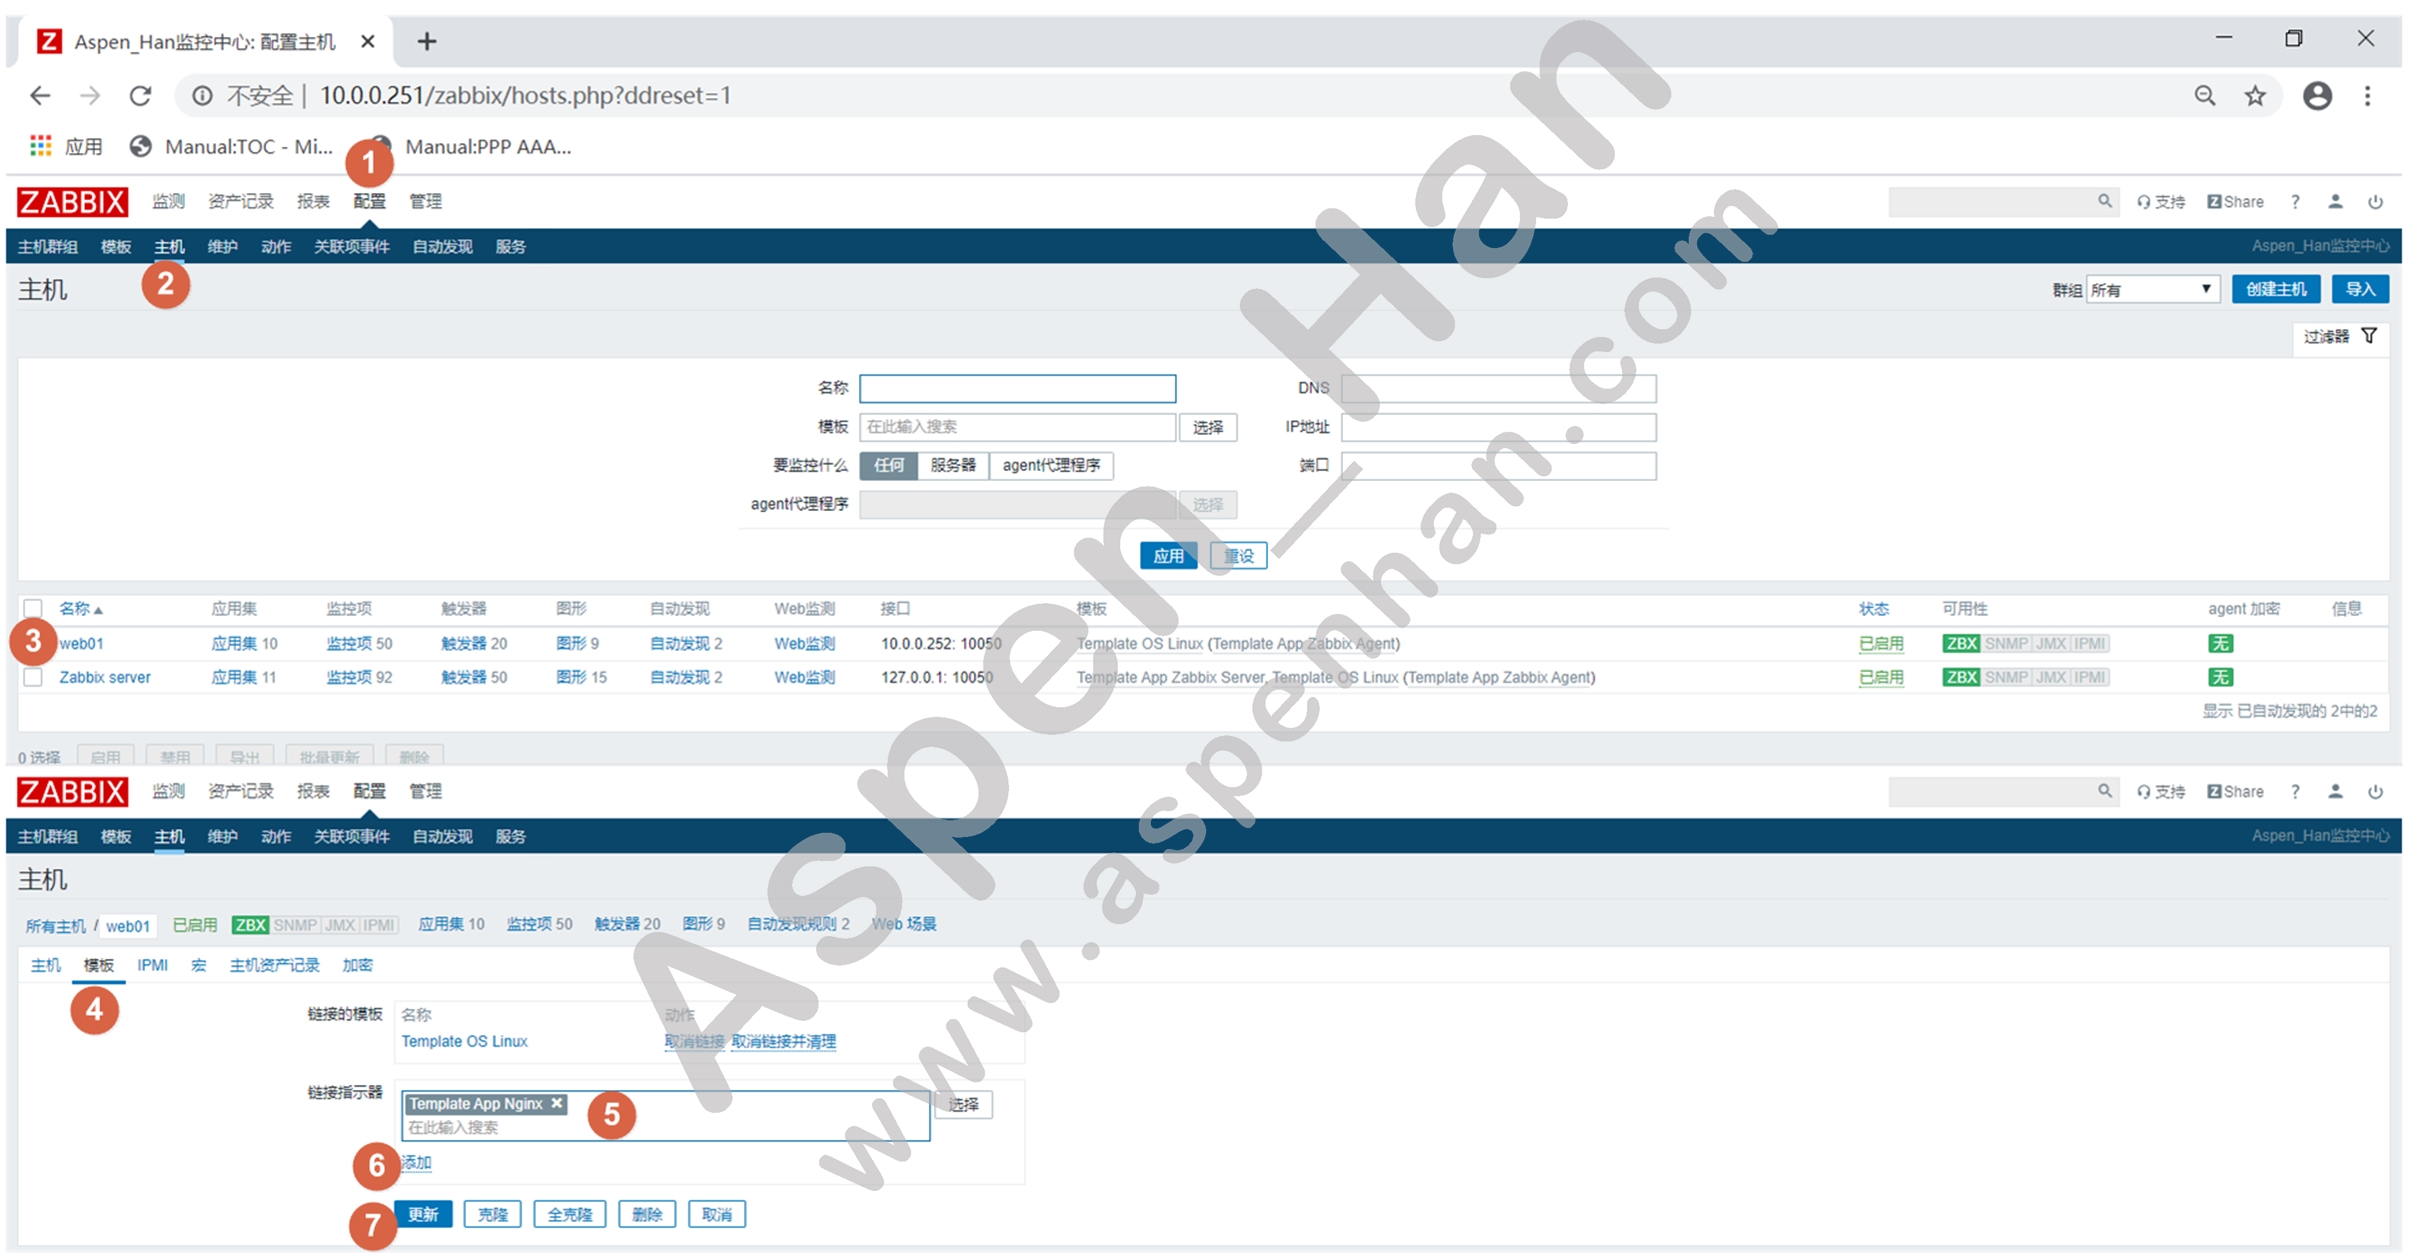
1step 7 目标主机关联模板
| 配置 -> 主机 -> 特定主机 -> 模板 |
3. 自定义模版
本文以监控TCP的11种状态为例
step 1 命令行或脚本取得监控值
| netstat -antu |grep -c 状态 |
[root@zabbix-web /etc/zabbix/zabbix_agentd.d]# netstat -antu | grep -c ESTABLISHED
1
[root@zabbix-web /etc/zabbix/zabbix_agentd.d]# netstat -antu | grep -c TIME_WAIT
54
[root@zabbix-web /etc/zabbix/zabbix_agentd.d]# netstat -antu | grep -c LISTEN
7
step 2 定义监控项
|
#include=/etc/zabbix/zabbix_agentd.d/*.conf UserParameter=键名[*],取值脚本 变量 |
[root@zabbix-web /etc/zabbix/zabbix_agentd.d]# cat userparameter_tcp.status.conf
UserParameter=tcp.stat[*],netstat -antu | grep -c $1
step 3 重启Zabbix-Agent
| systemctl restart zabbix-agent |
[root@zabbix-web /etc/zabbix/zabbix_agentd.d]# systemctl restart zabbix-agent.servicestep 4 手动测试监控项
| zabbix_get -s IP地址 -k 监控项 |
[root@zabbix-server ~]# zabbix_get -s 10.0.0.252 -k tcp.stat[LISTEN]
7
[root@zabbix-server ~]# zabbix_get -s 10.0.0.252 -k tcp.stat[TIME_WAIT]
57
step 5 添加监控项(Web端)
| 配置 -> 主机 -> 指定主机 -> 监控项 -> 创建监控项 |
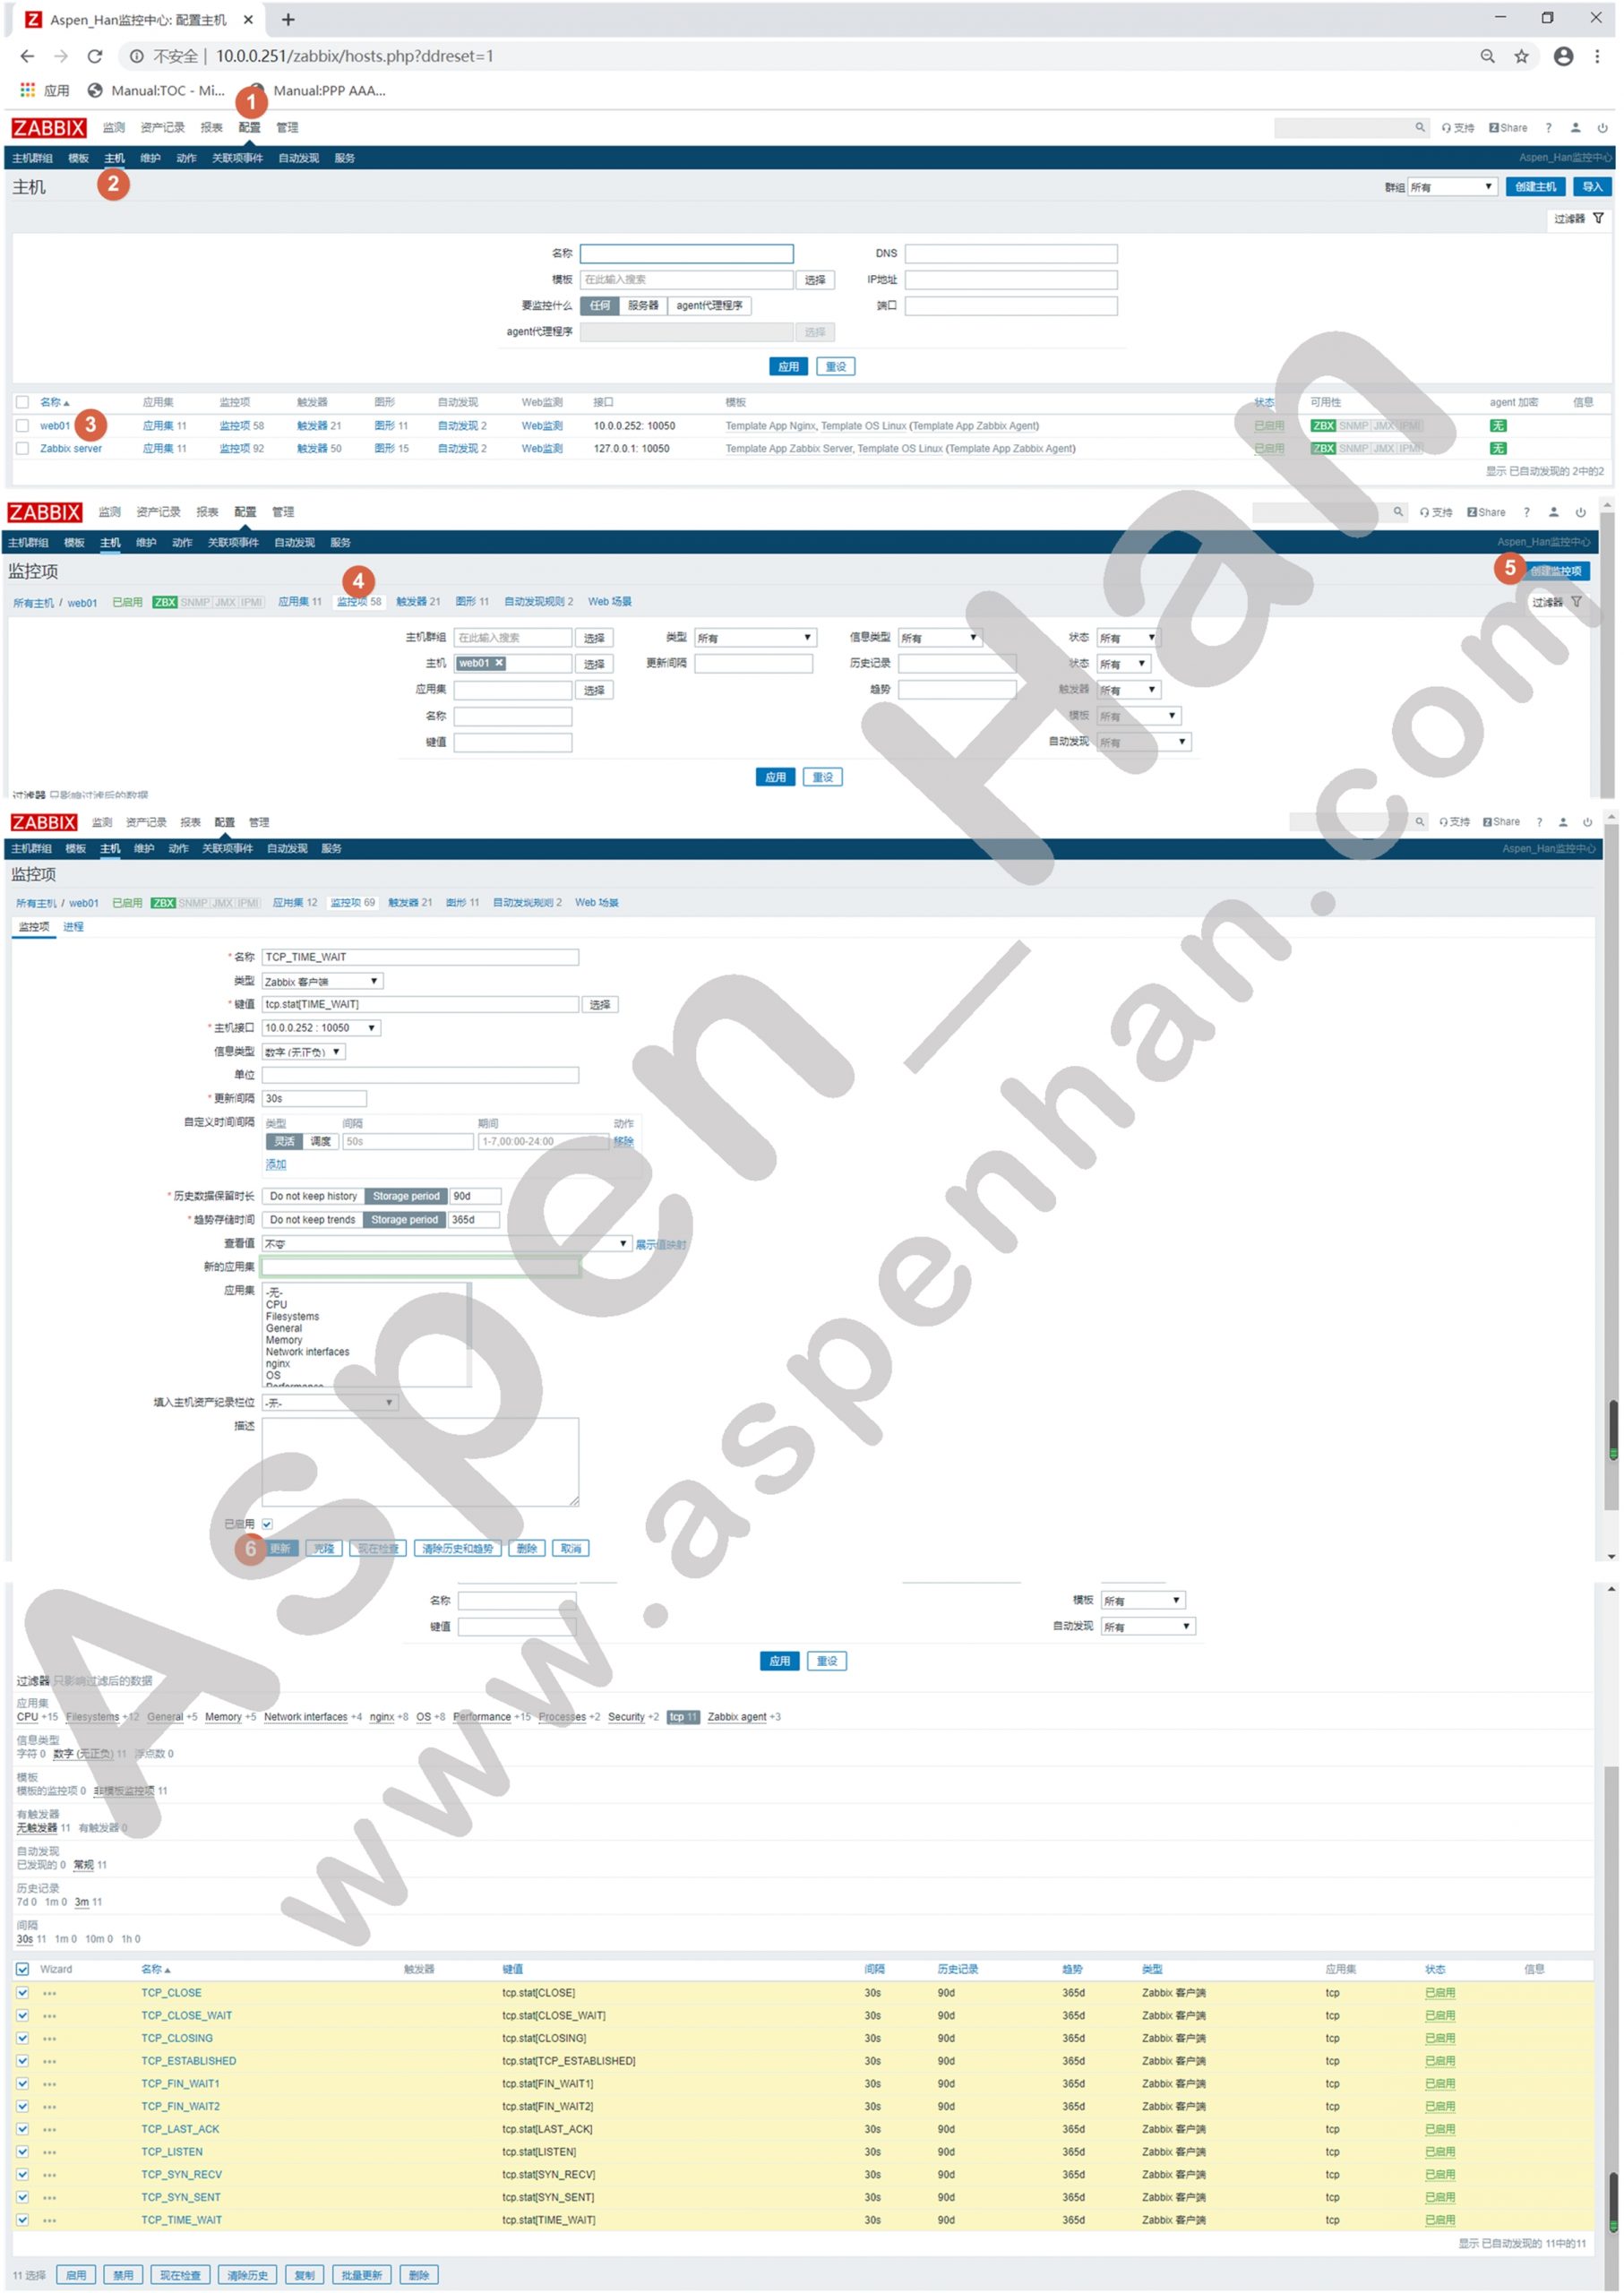
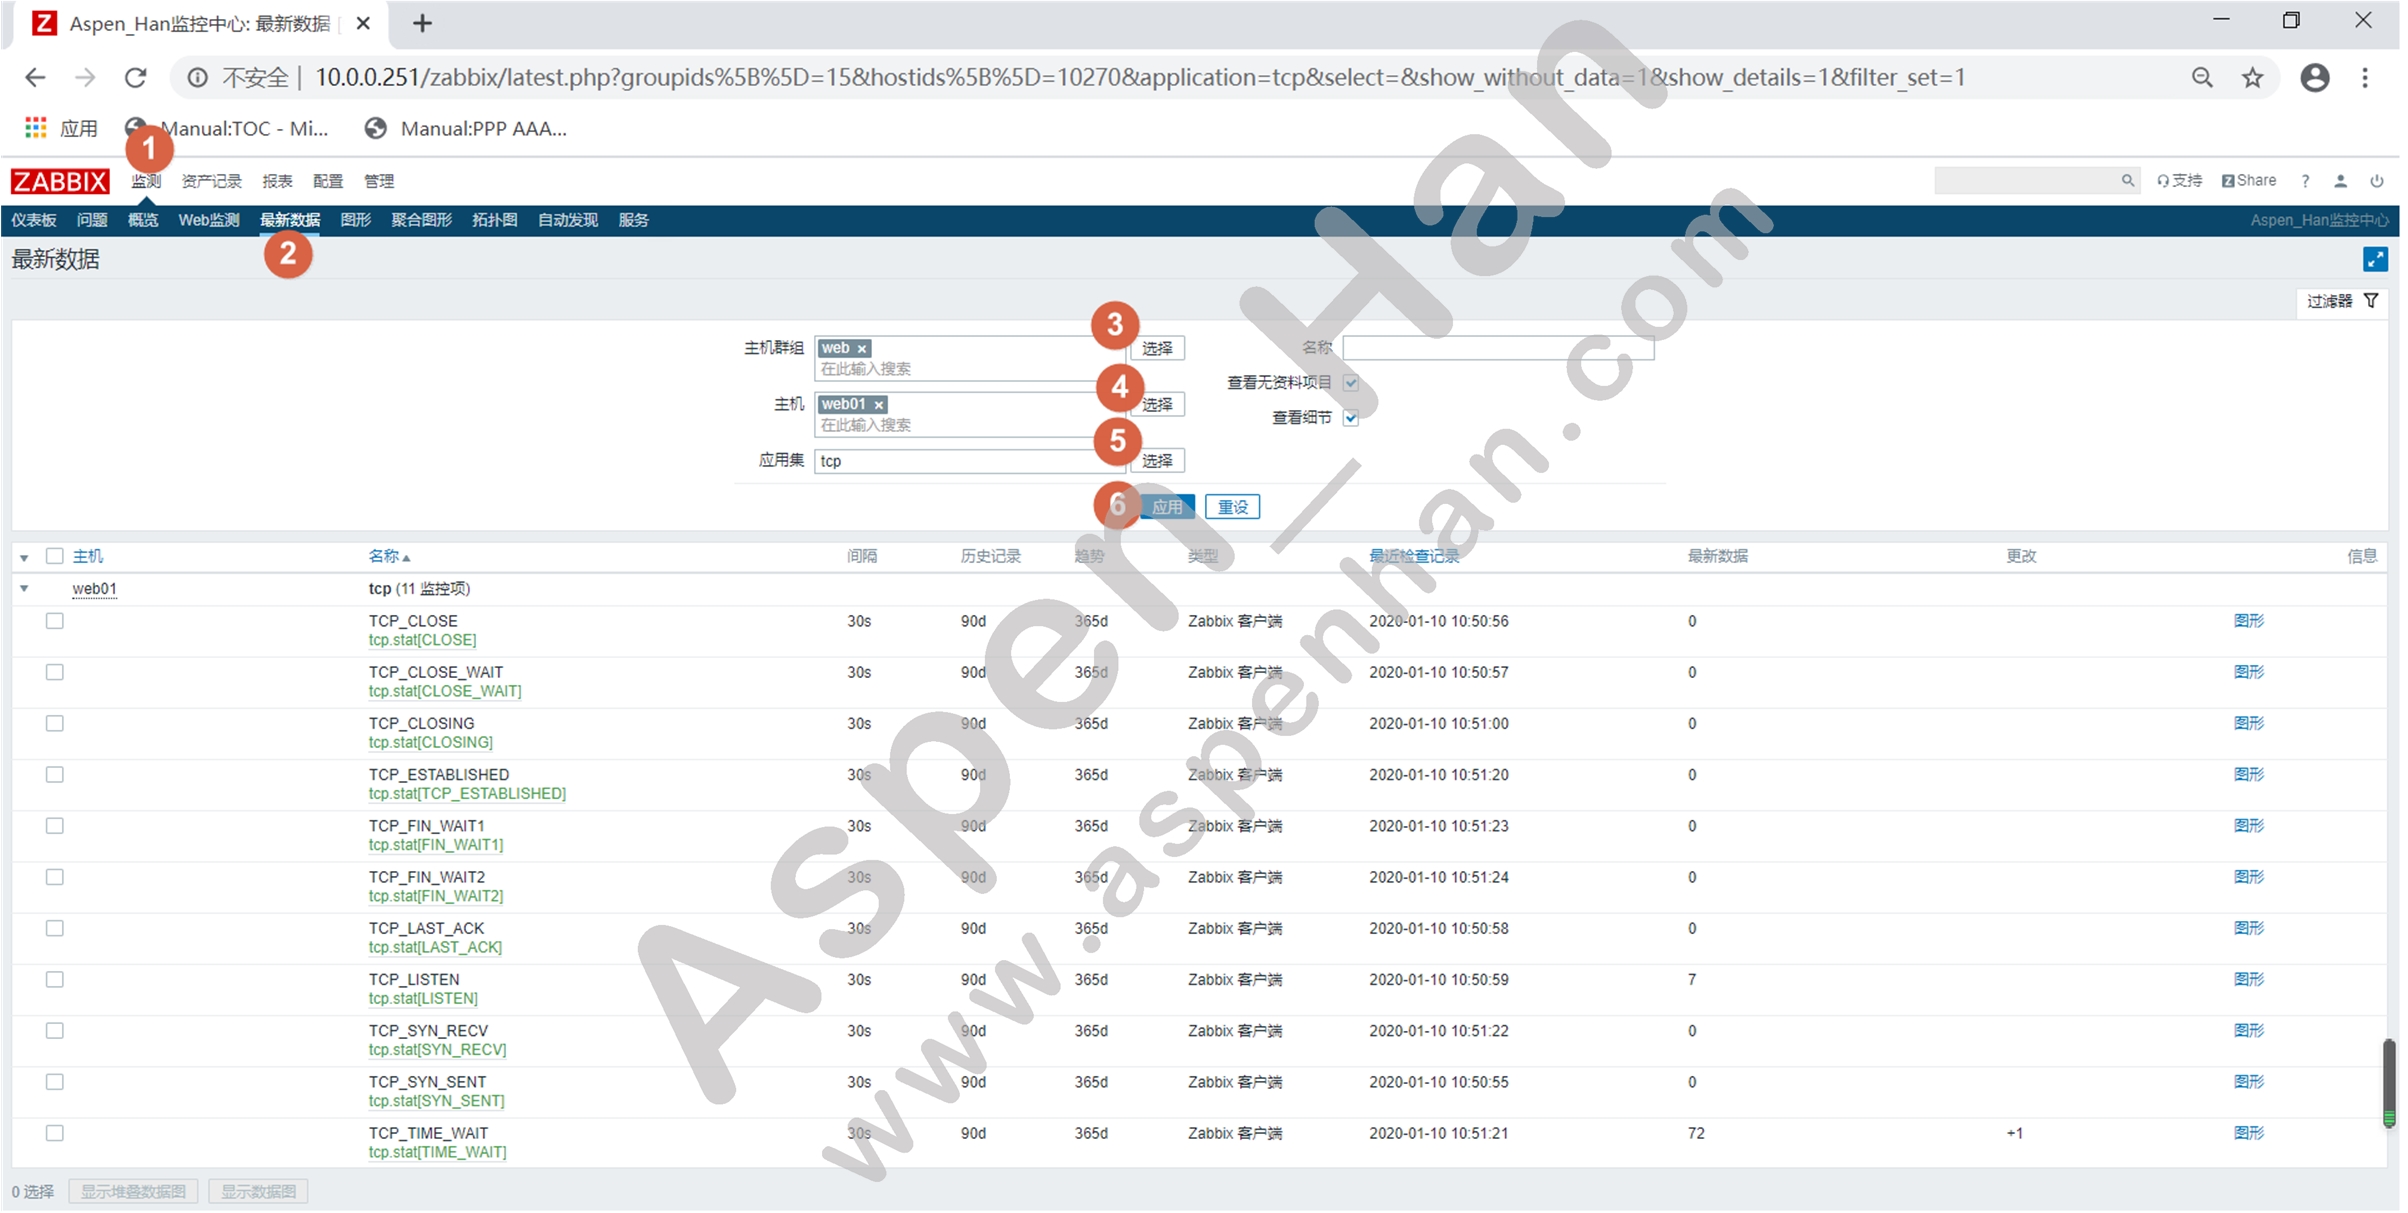
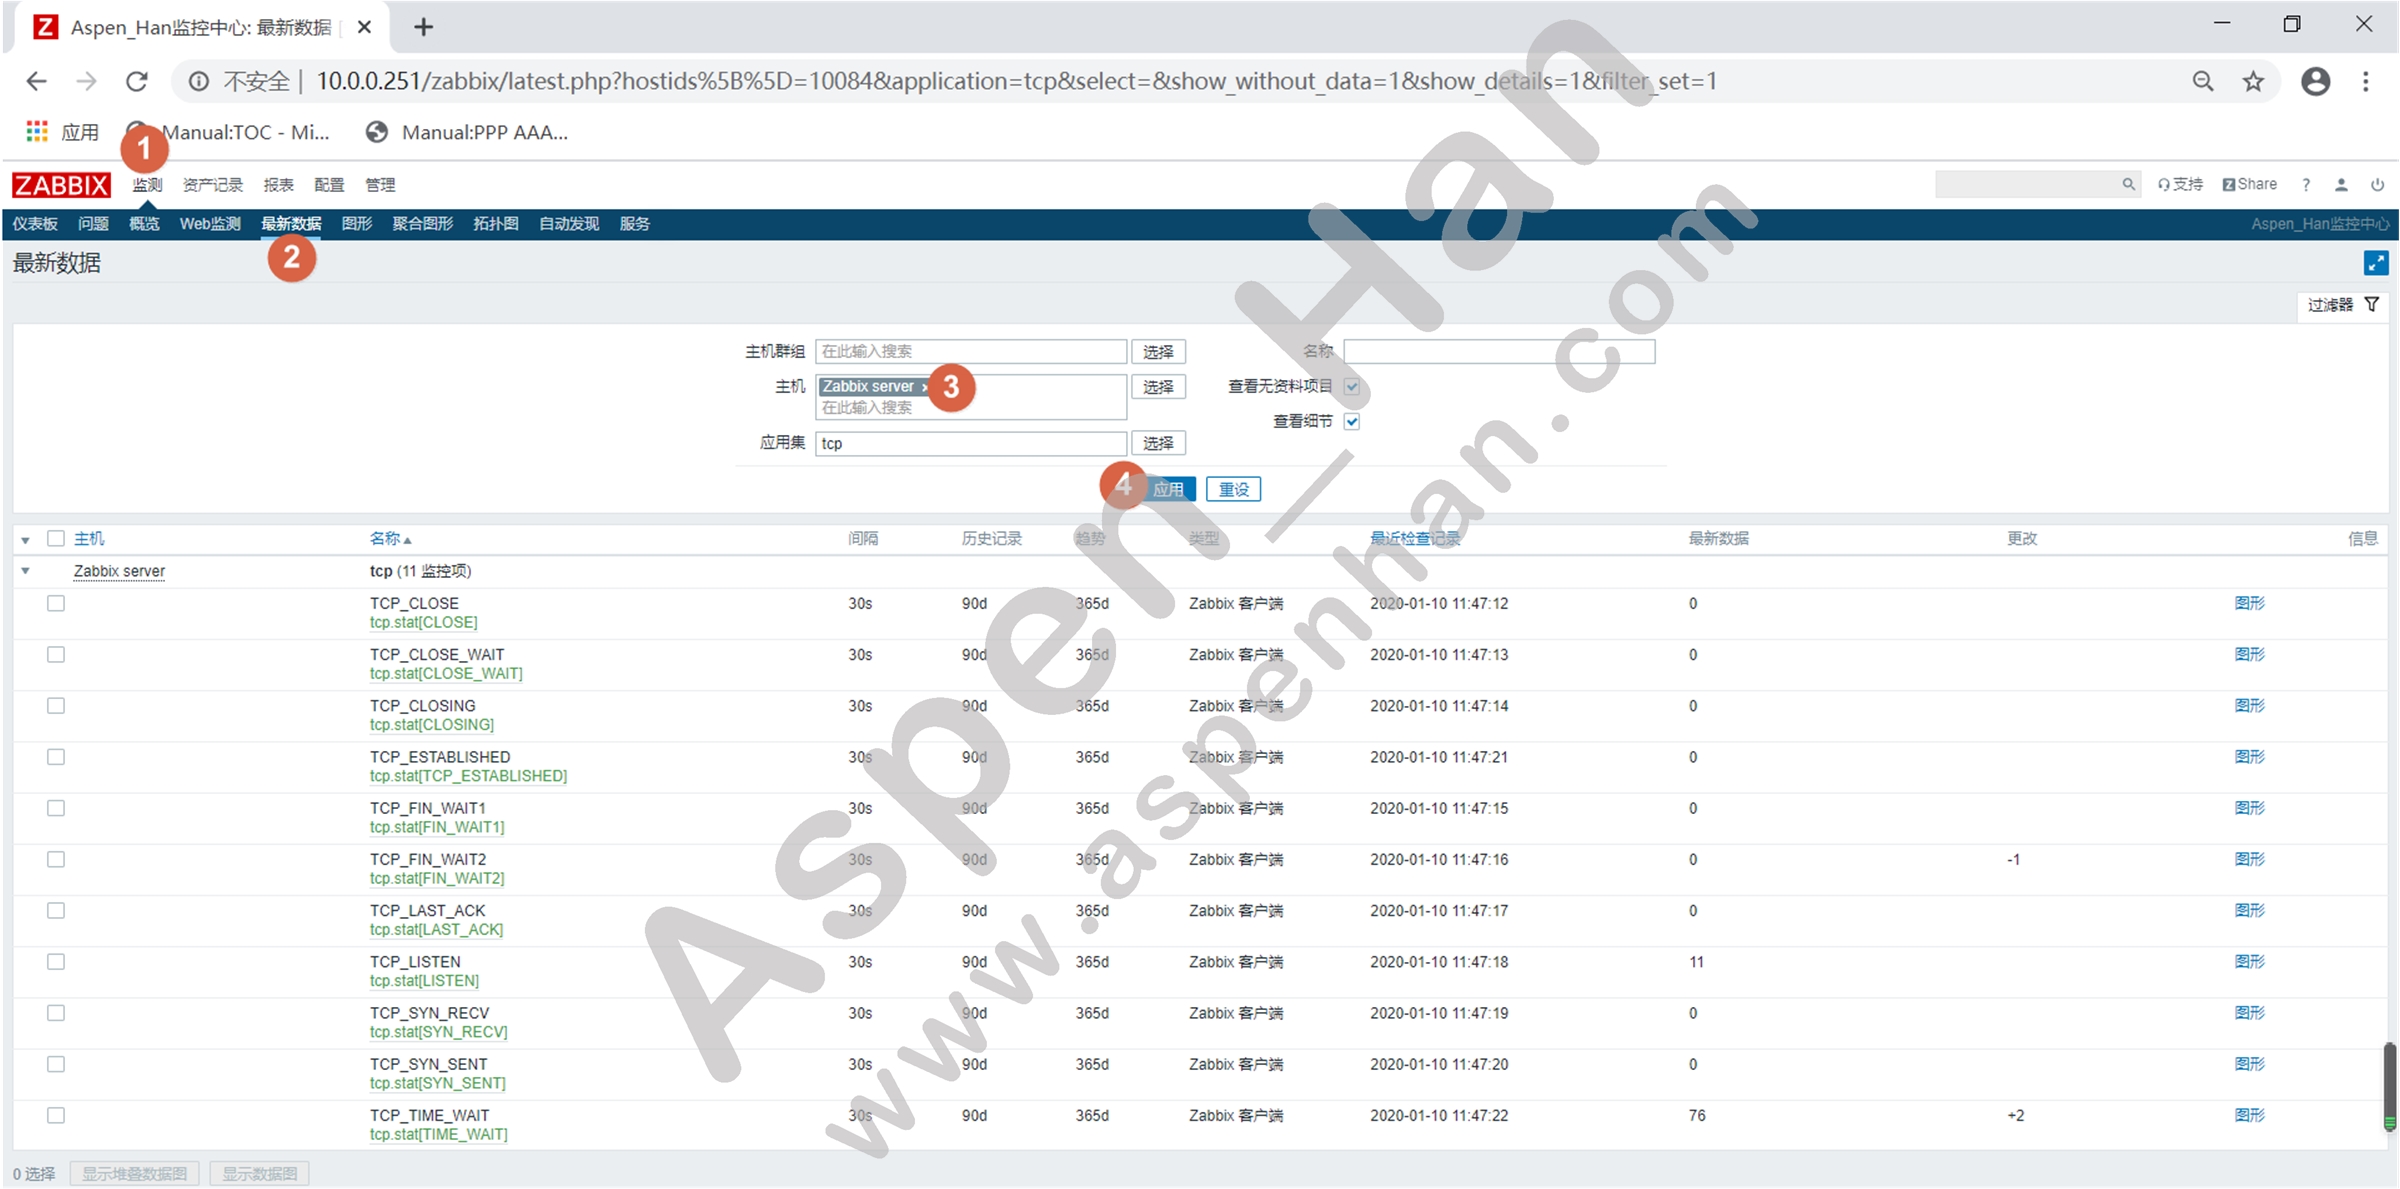
step 6 确认监控状态
| 监测 -> 最新数据 -> 指定主机 -> 应用 |
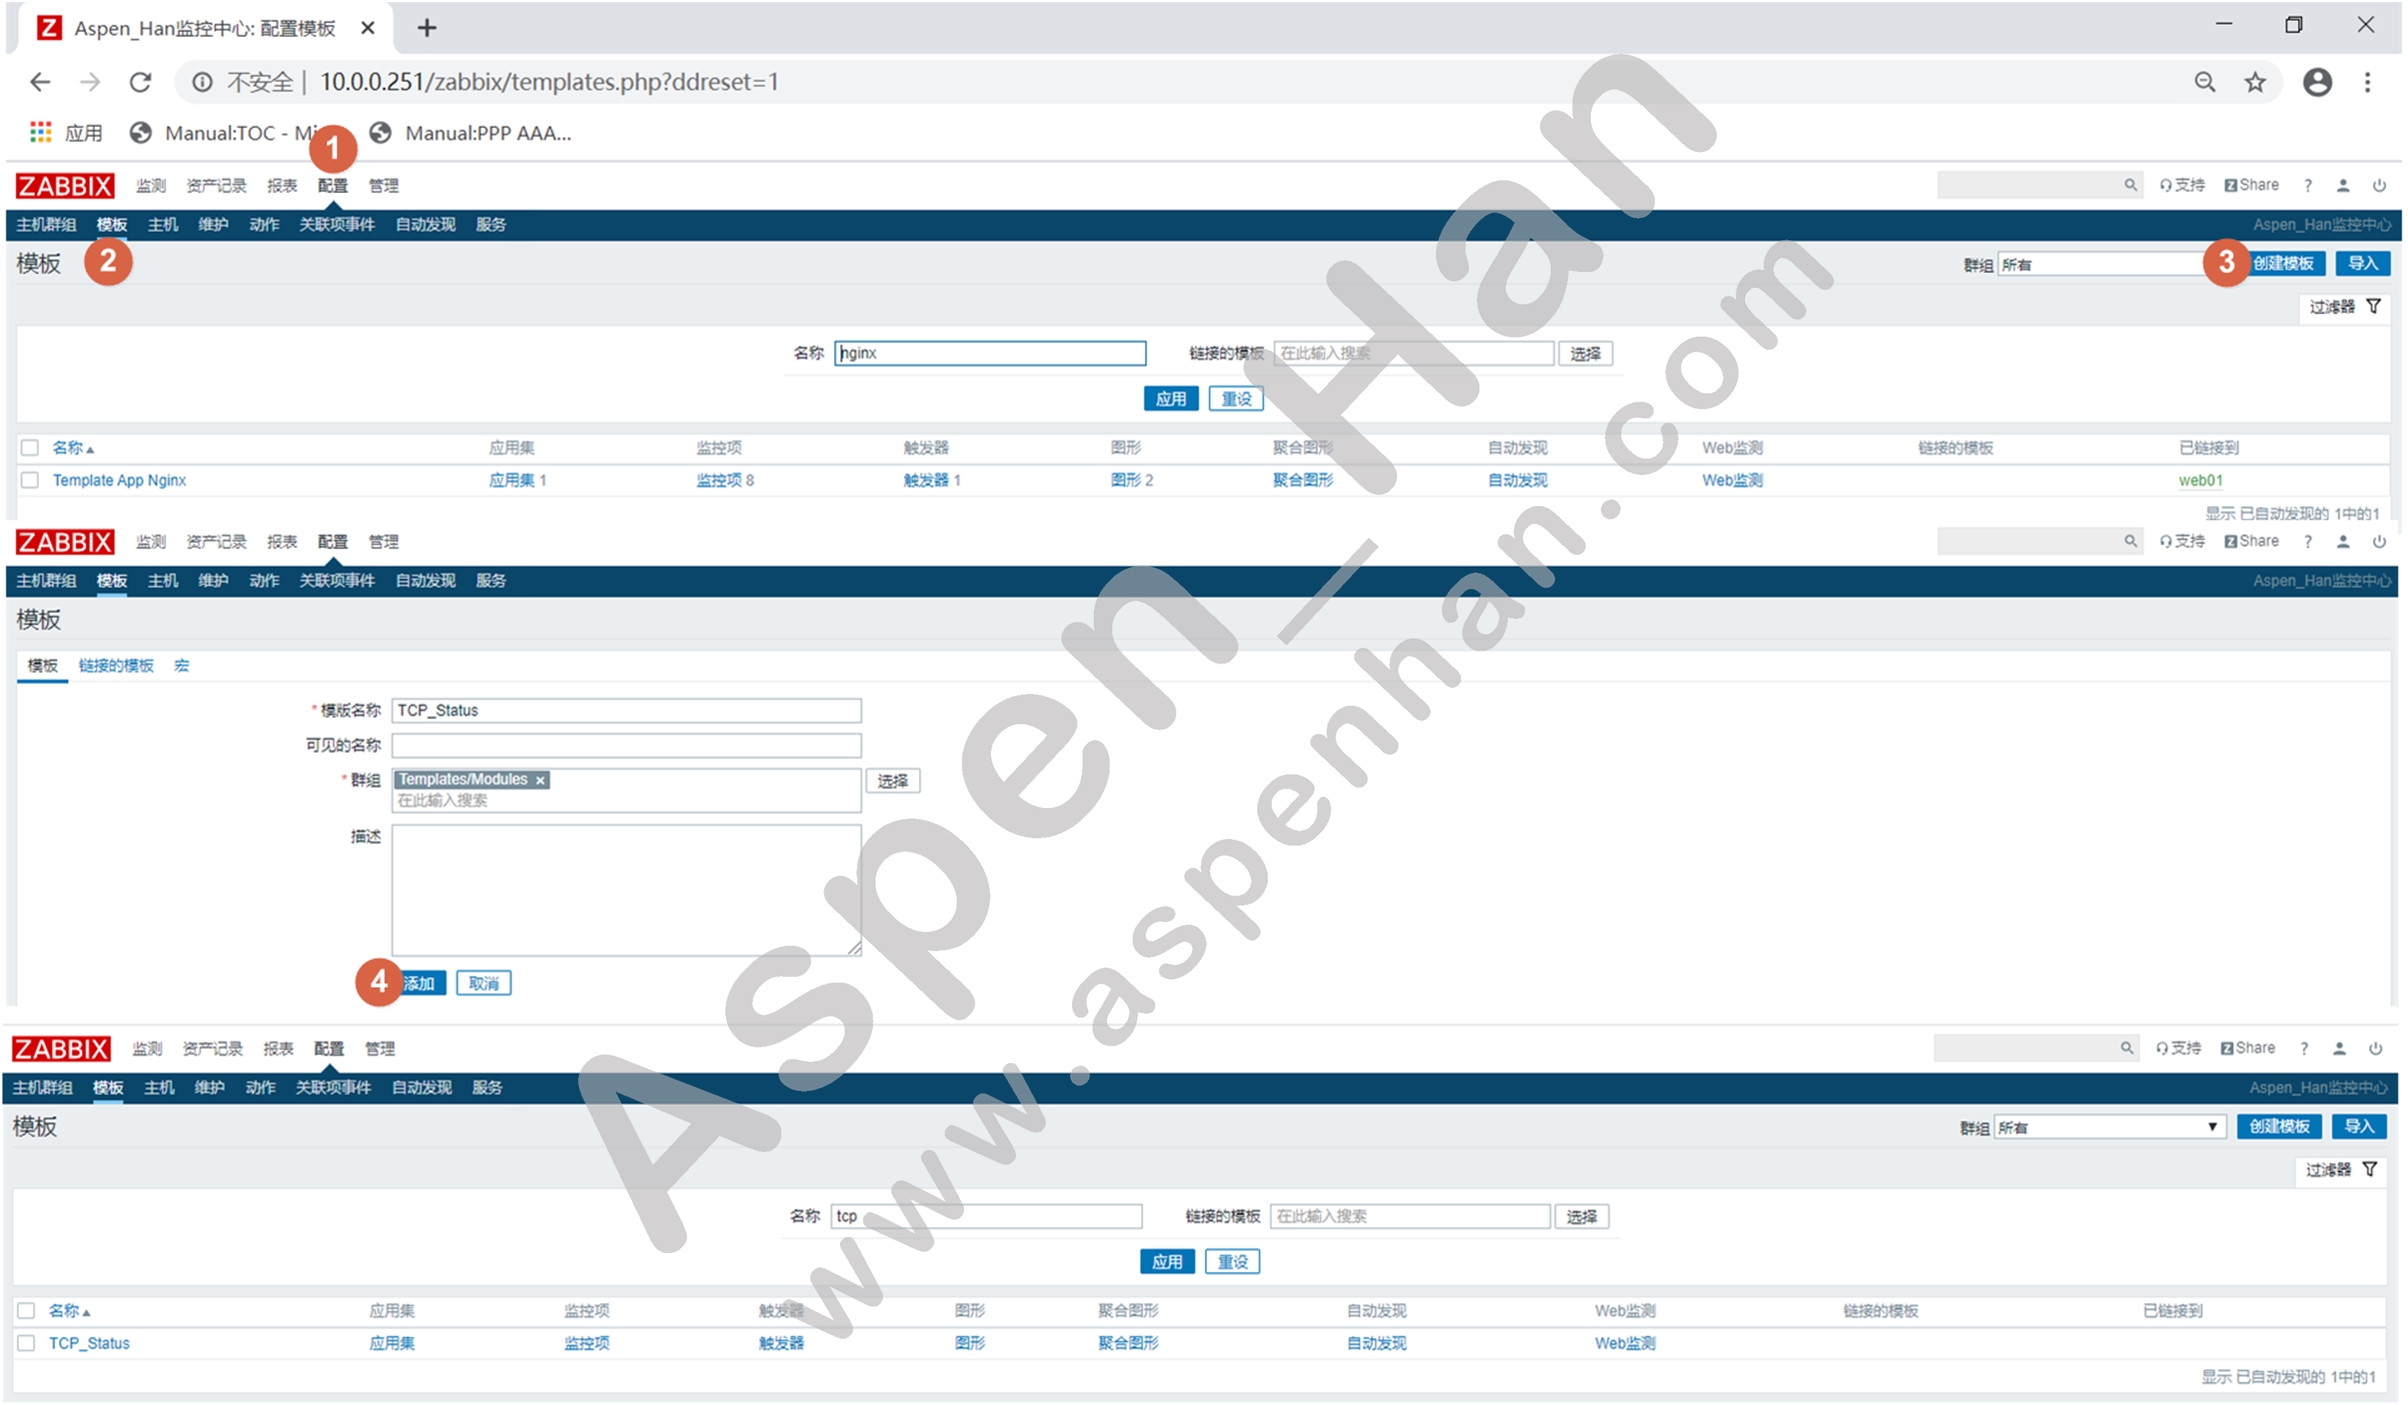
step 7 创建模板
| 配置 -> 模版 -> 创建模版 |
step 8 将监控项复制至模板
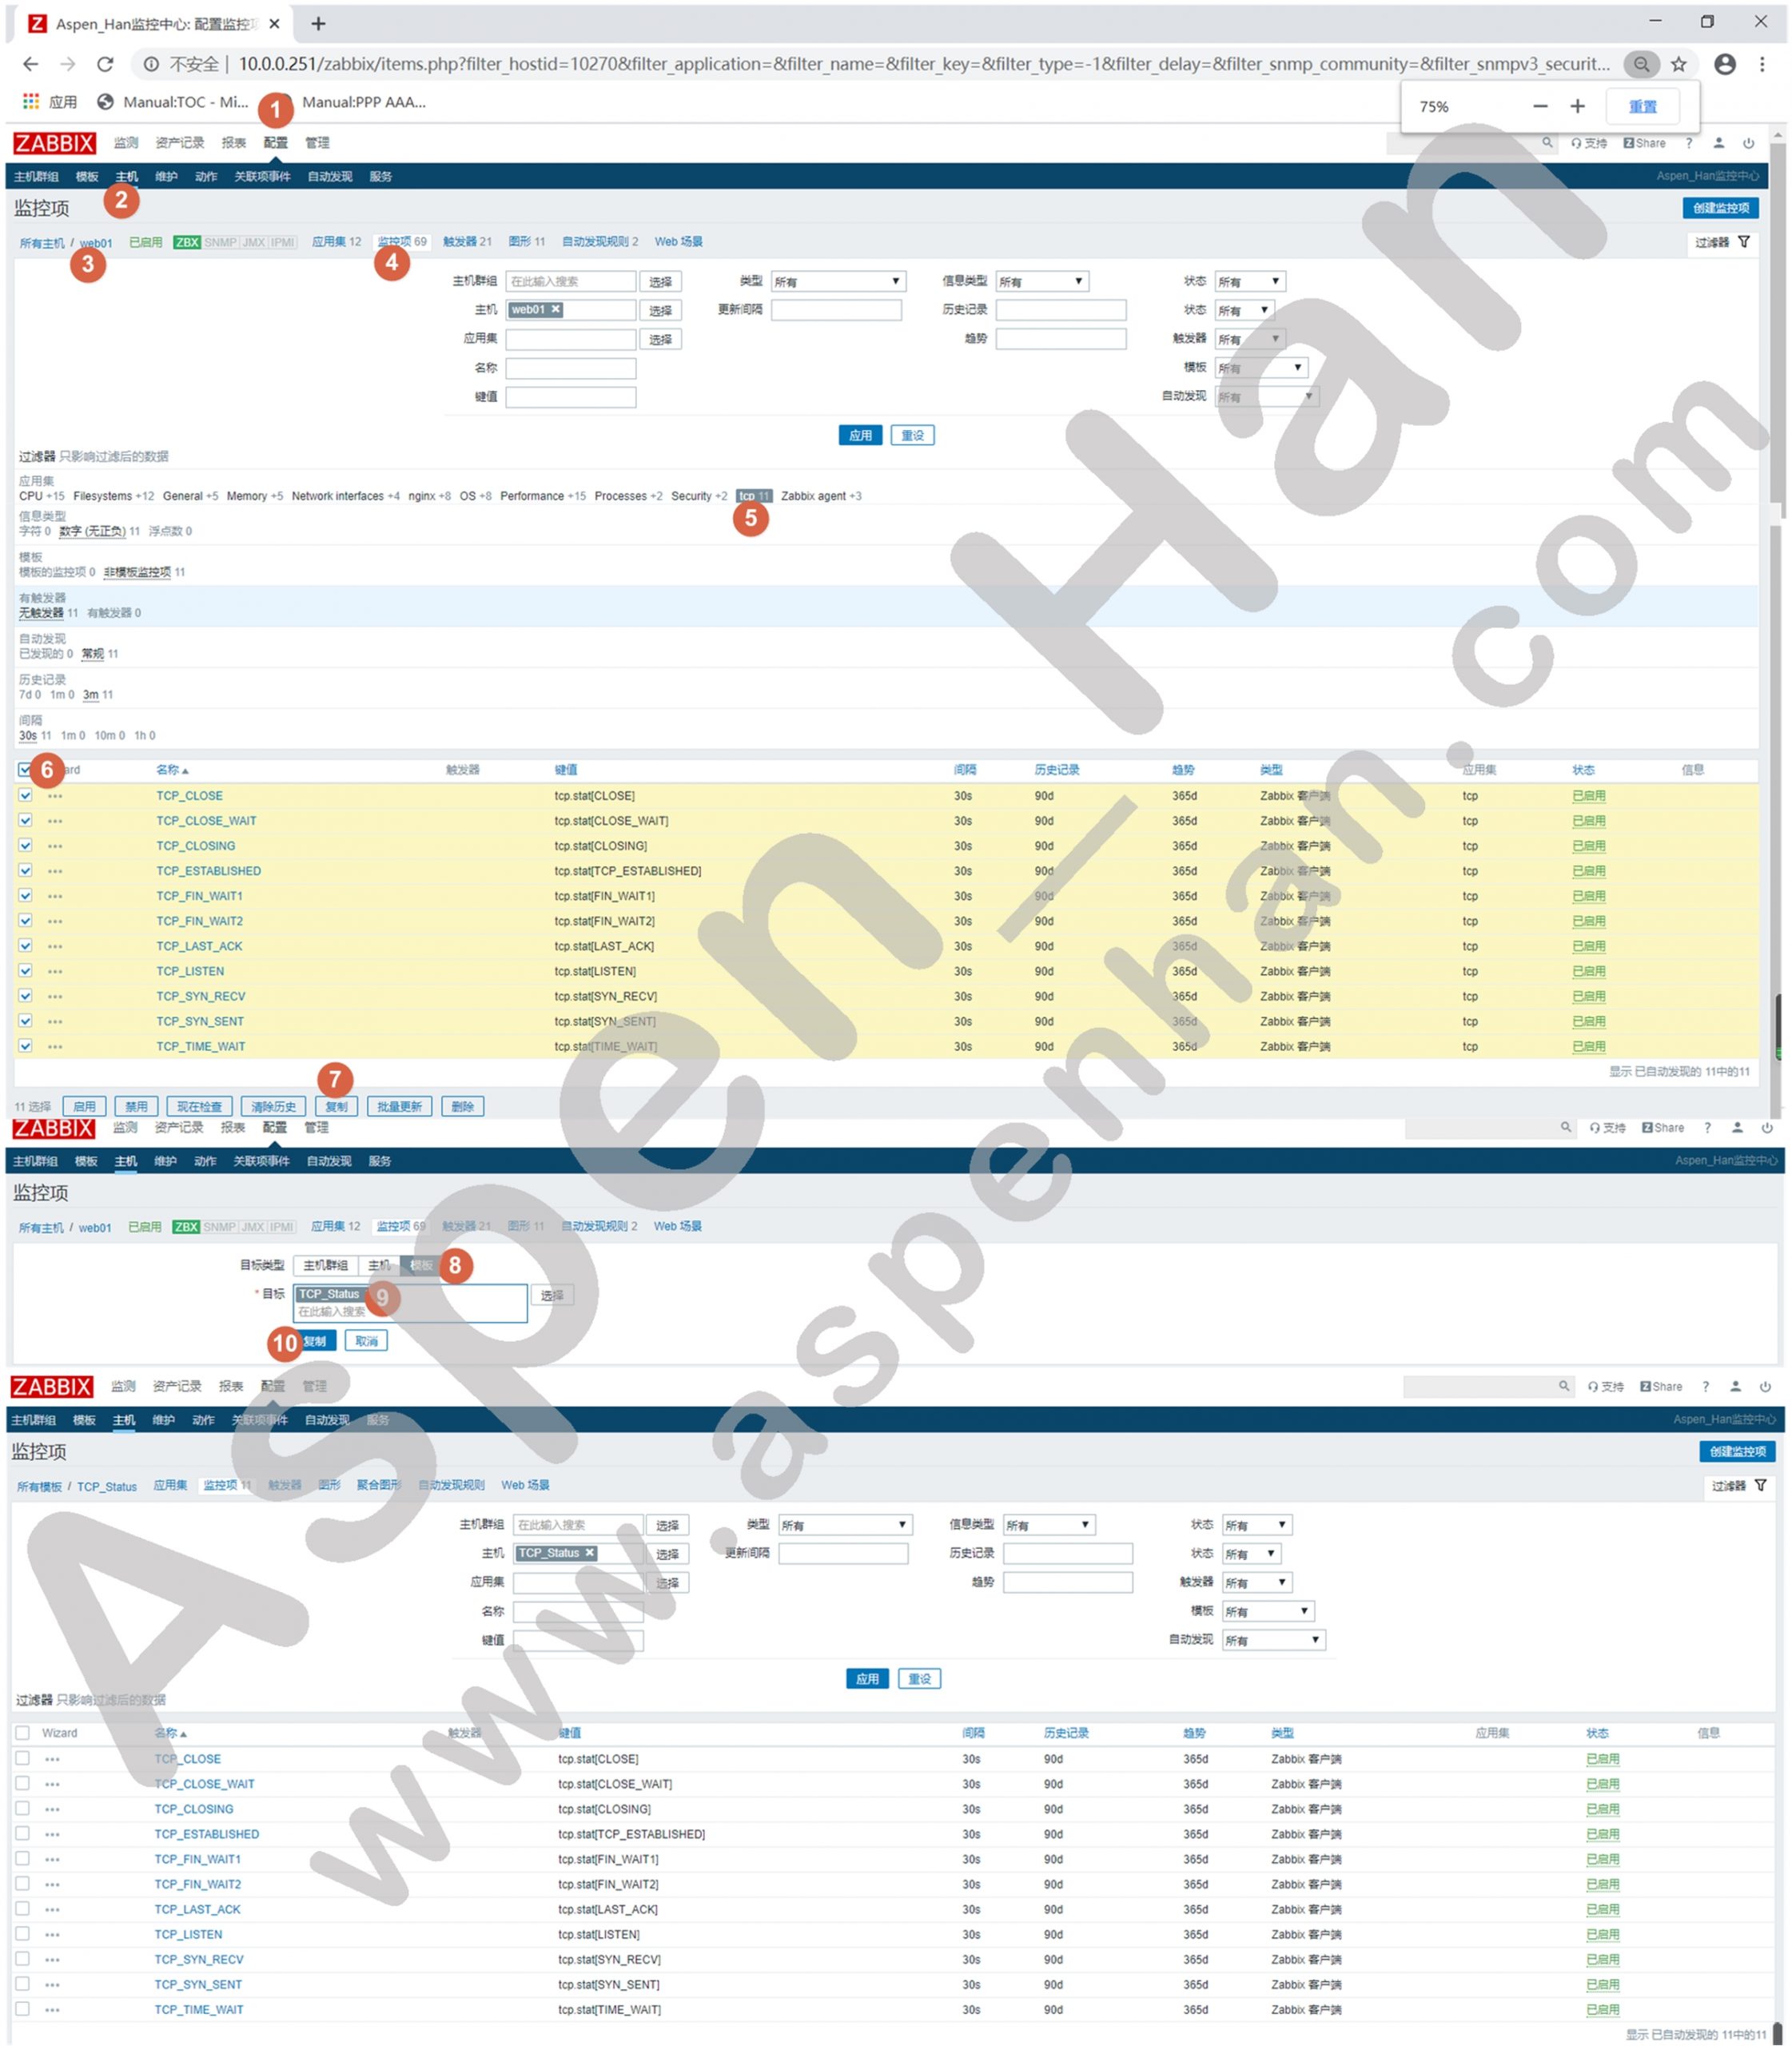
step 9 应用模板
| 配置 -> 主机 -> 指定主机 -> 模板 |

step 10 同步监控项配置文件
| scp -rp /etc/zabbix/zabbix_agentd.d/*.conf IP地址:/etc/zabbix/zabbix_agentd.d/*.conf |
[root@zabbix-server ~]# cd /etc/zabbix/zabbix_agentd.d/
[root@zabbix-server /etc/zabbix/zabbix_agentd.d]# ls
userparameter_disk.conf  userparameter_mysql.conf
[root@zabbix-server /etc/zabbix/zabbix_agentd.d]# scp -rp 10.0.0.252:`pwd`/userparameter_tcp.status.conf .
root@10.0.0.252's password:
userparameter_tcp.status.conf                                                 100%   53    71.7KB/s   00:00
[root@zabbix-server /etc/zabbix/zabbix_agentd.d]# ls
userparameter_disk.conf  userparameter_mysql.conf  userparameter_tcp.status.conf
step 11 重启Zabbix-Agent
| systemctl restart zabbix-agent |
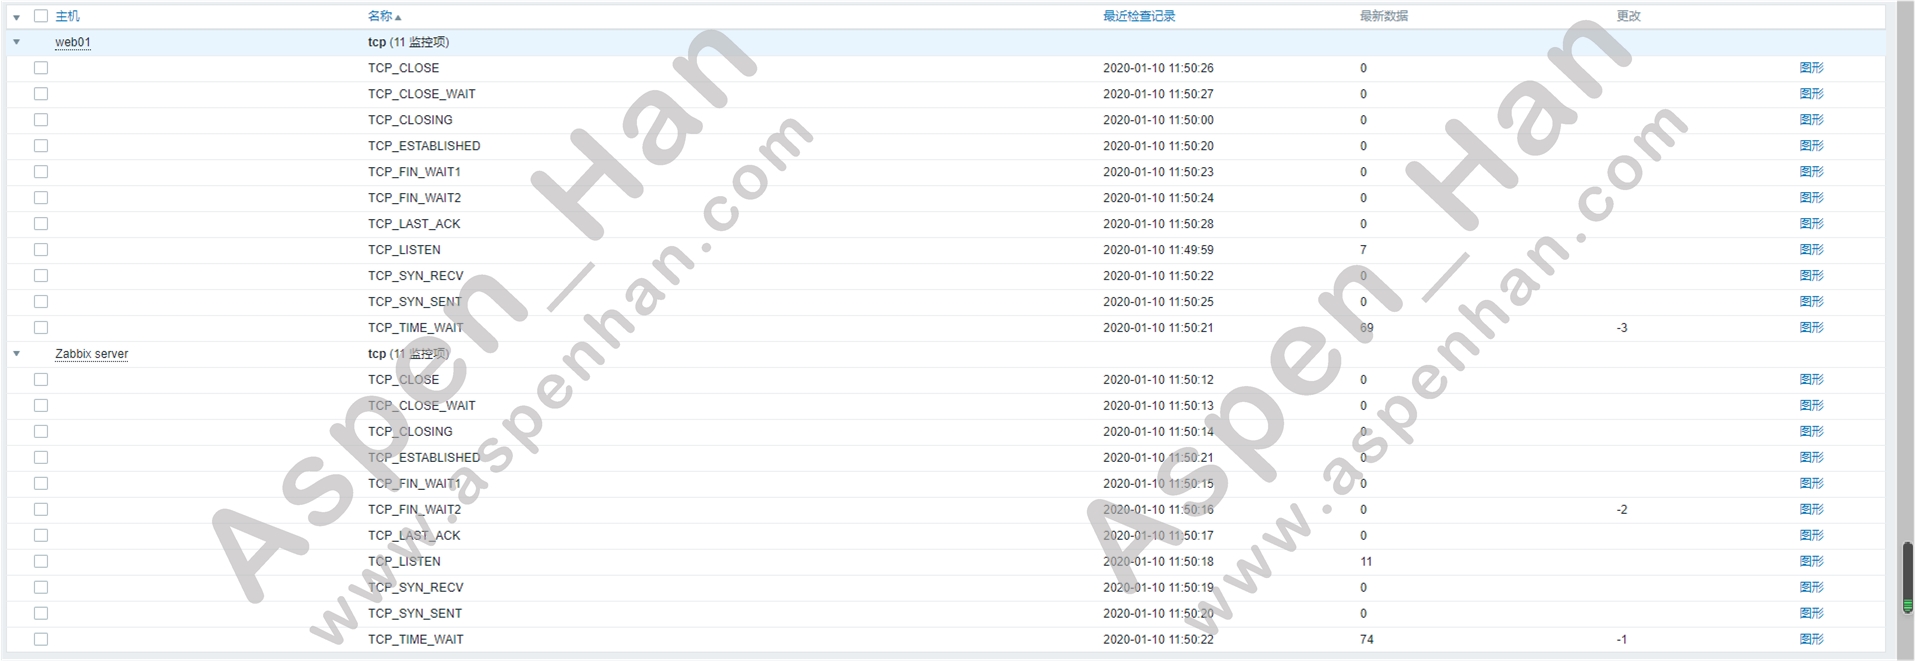
[root@zabbix-server /etc/zabbix/zabbix_agentd.d]# systemctl restart zabbix-agent.servicestep 12 确认监控状态
| 监测 -> 最新数据 -> 指定主机 -> 应用 |
五、Web与MySQL监控
1. Web网站的可用性监测
step 1 添加web监测项
| 配置 -> 主机 -> 特定主机 -> Web监测 -> 创建Web场景 ->场景 |
| 在实际生产环境中,检测频率一般为1m/次或5m/次 |

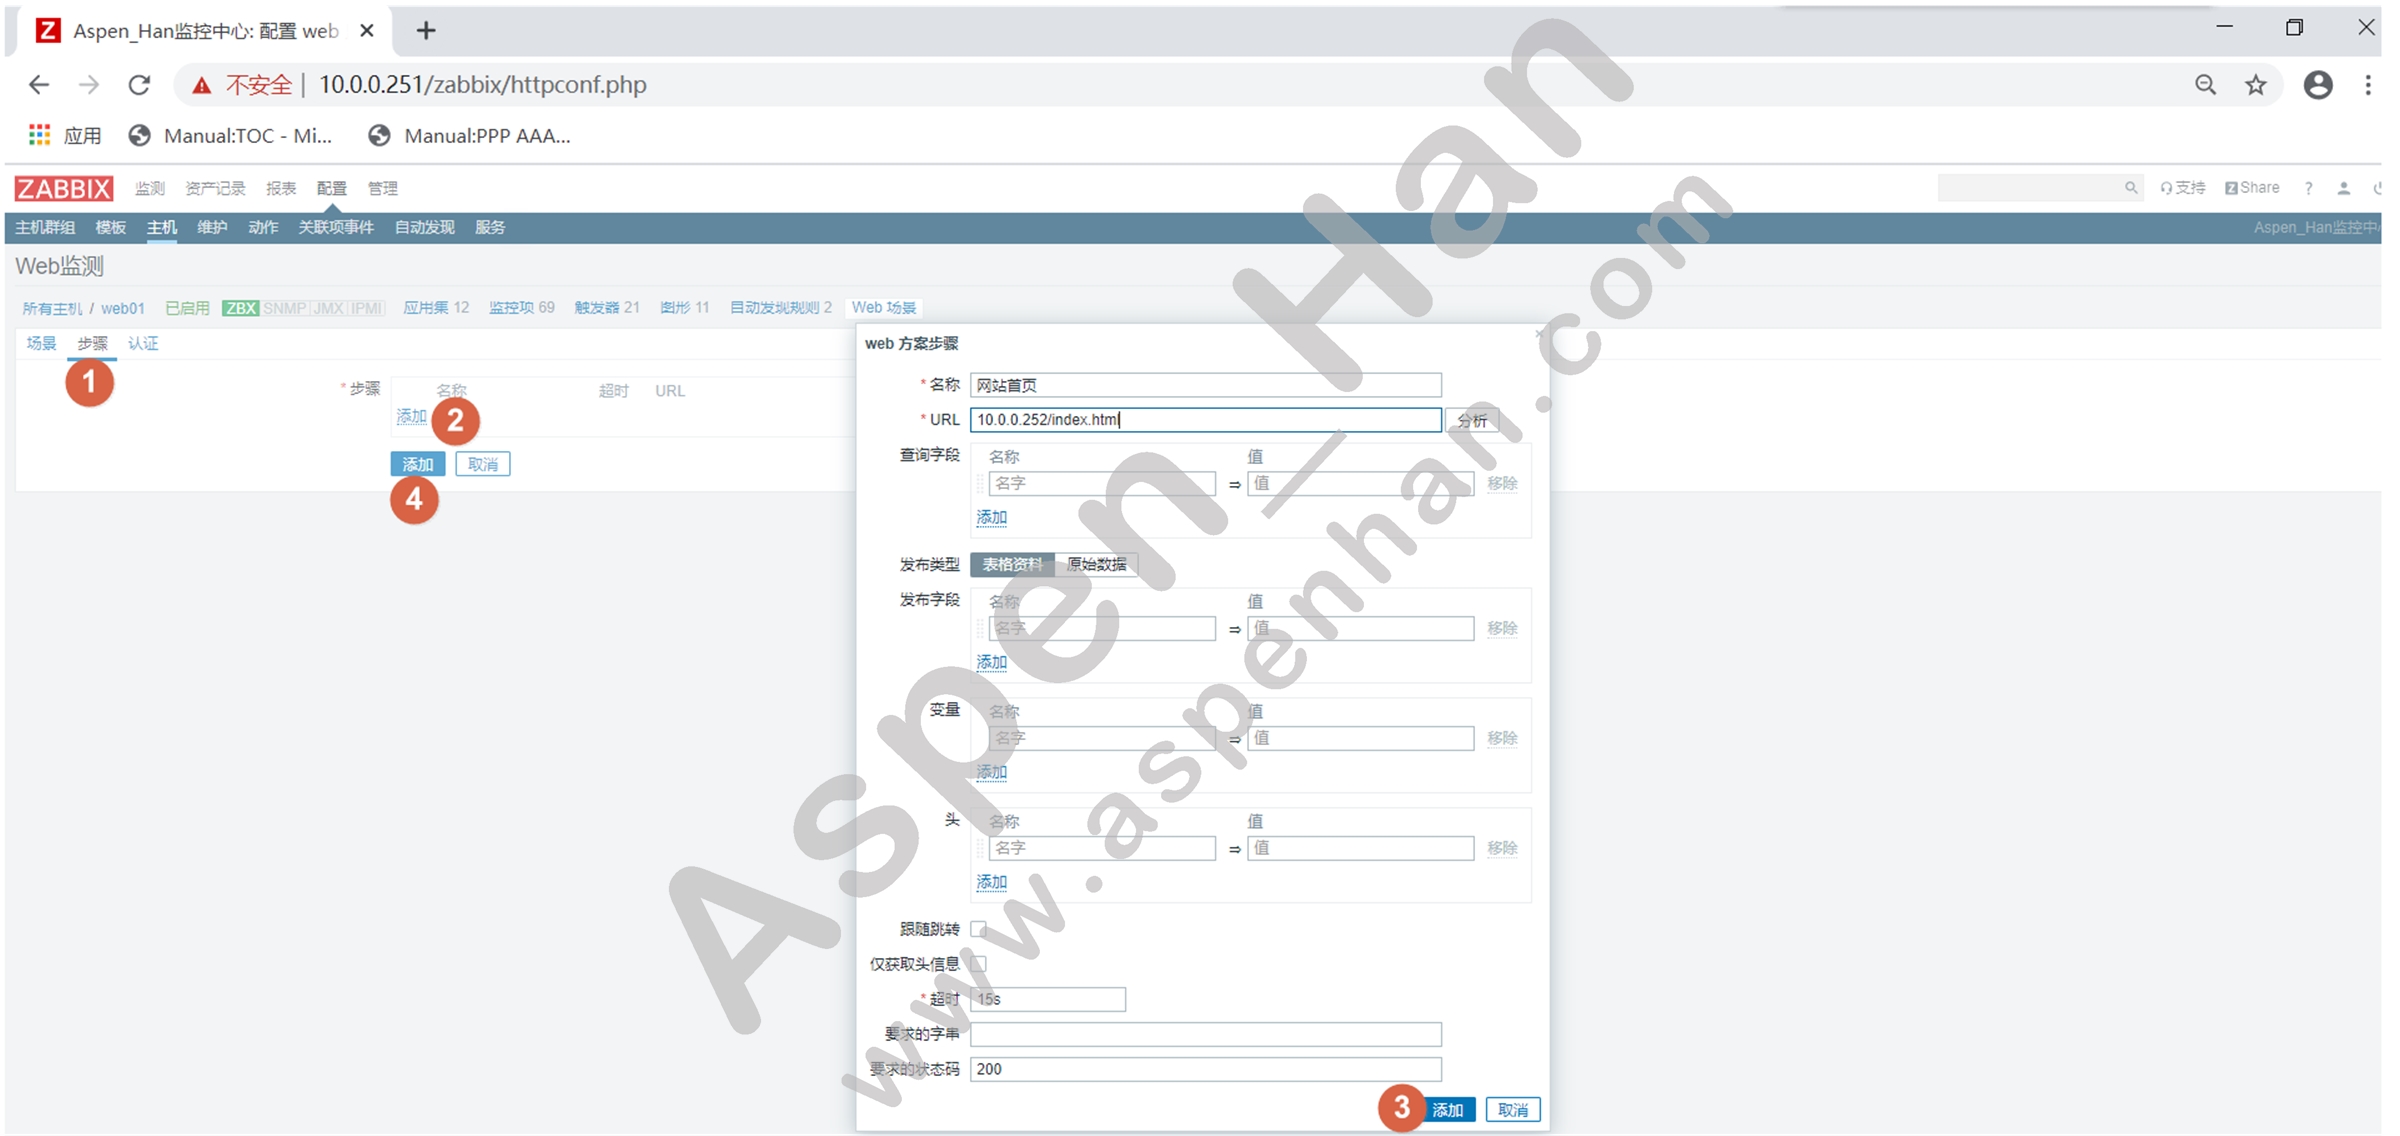
step 2 指定监控页面
| 配置 -> 主机 -> 特定主机 -> Web监测 -> 创建Web场景 -> 步骤 |
step 3 验证检测状态
| 检测 -> Web监测 -> 特定主机 -> 监测项名称 |

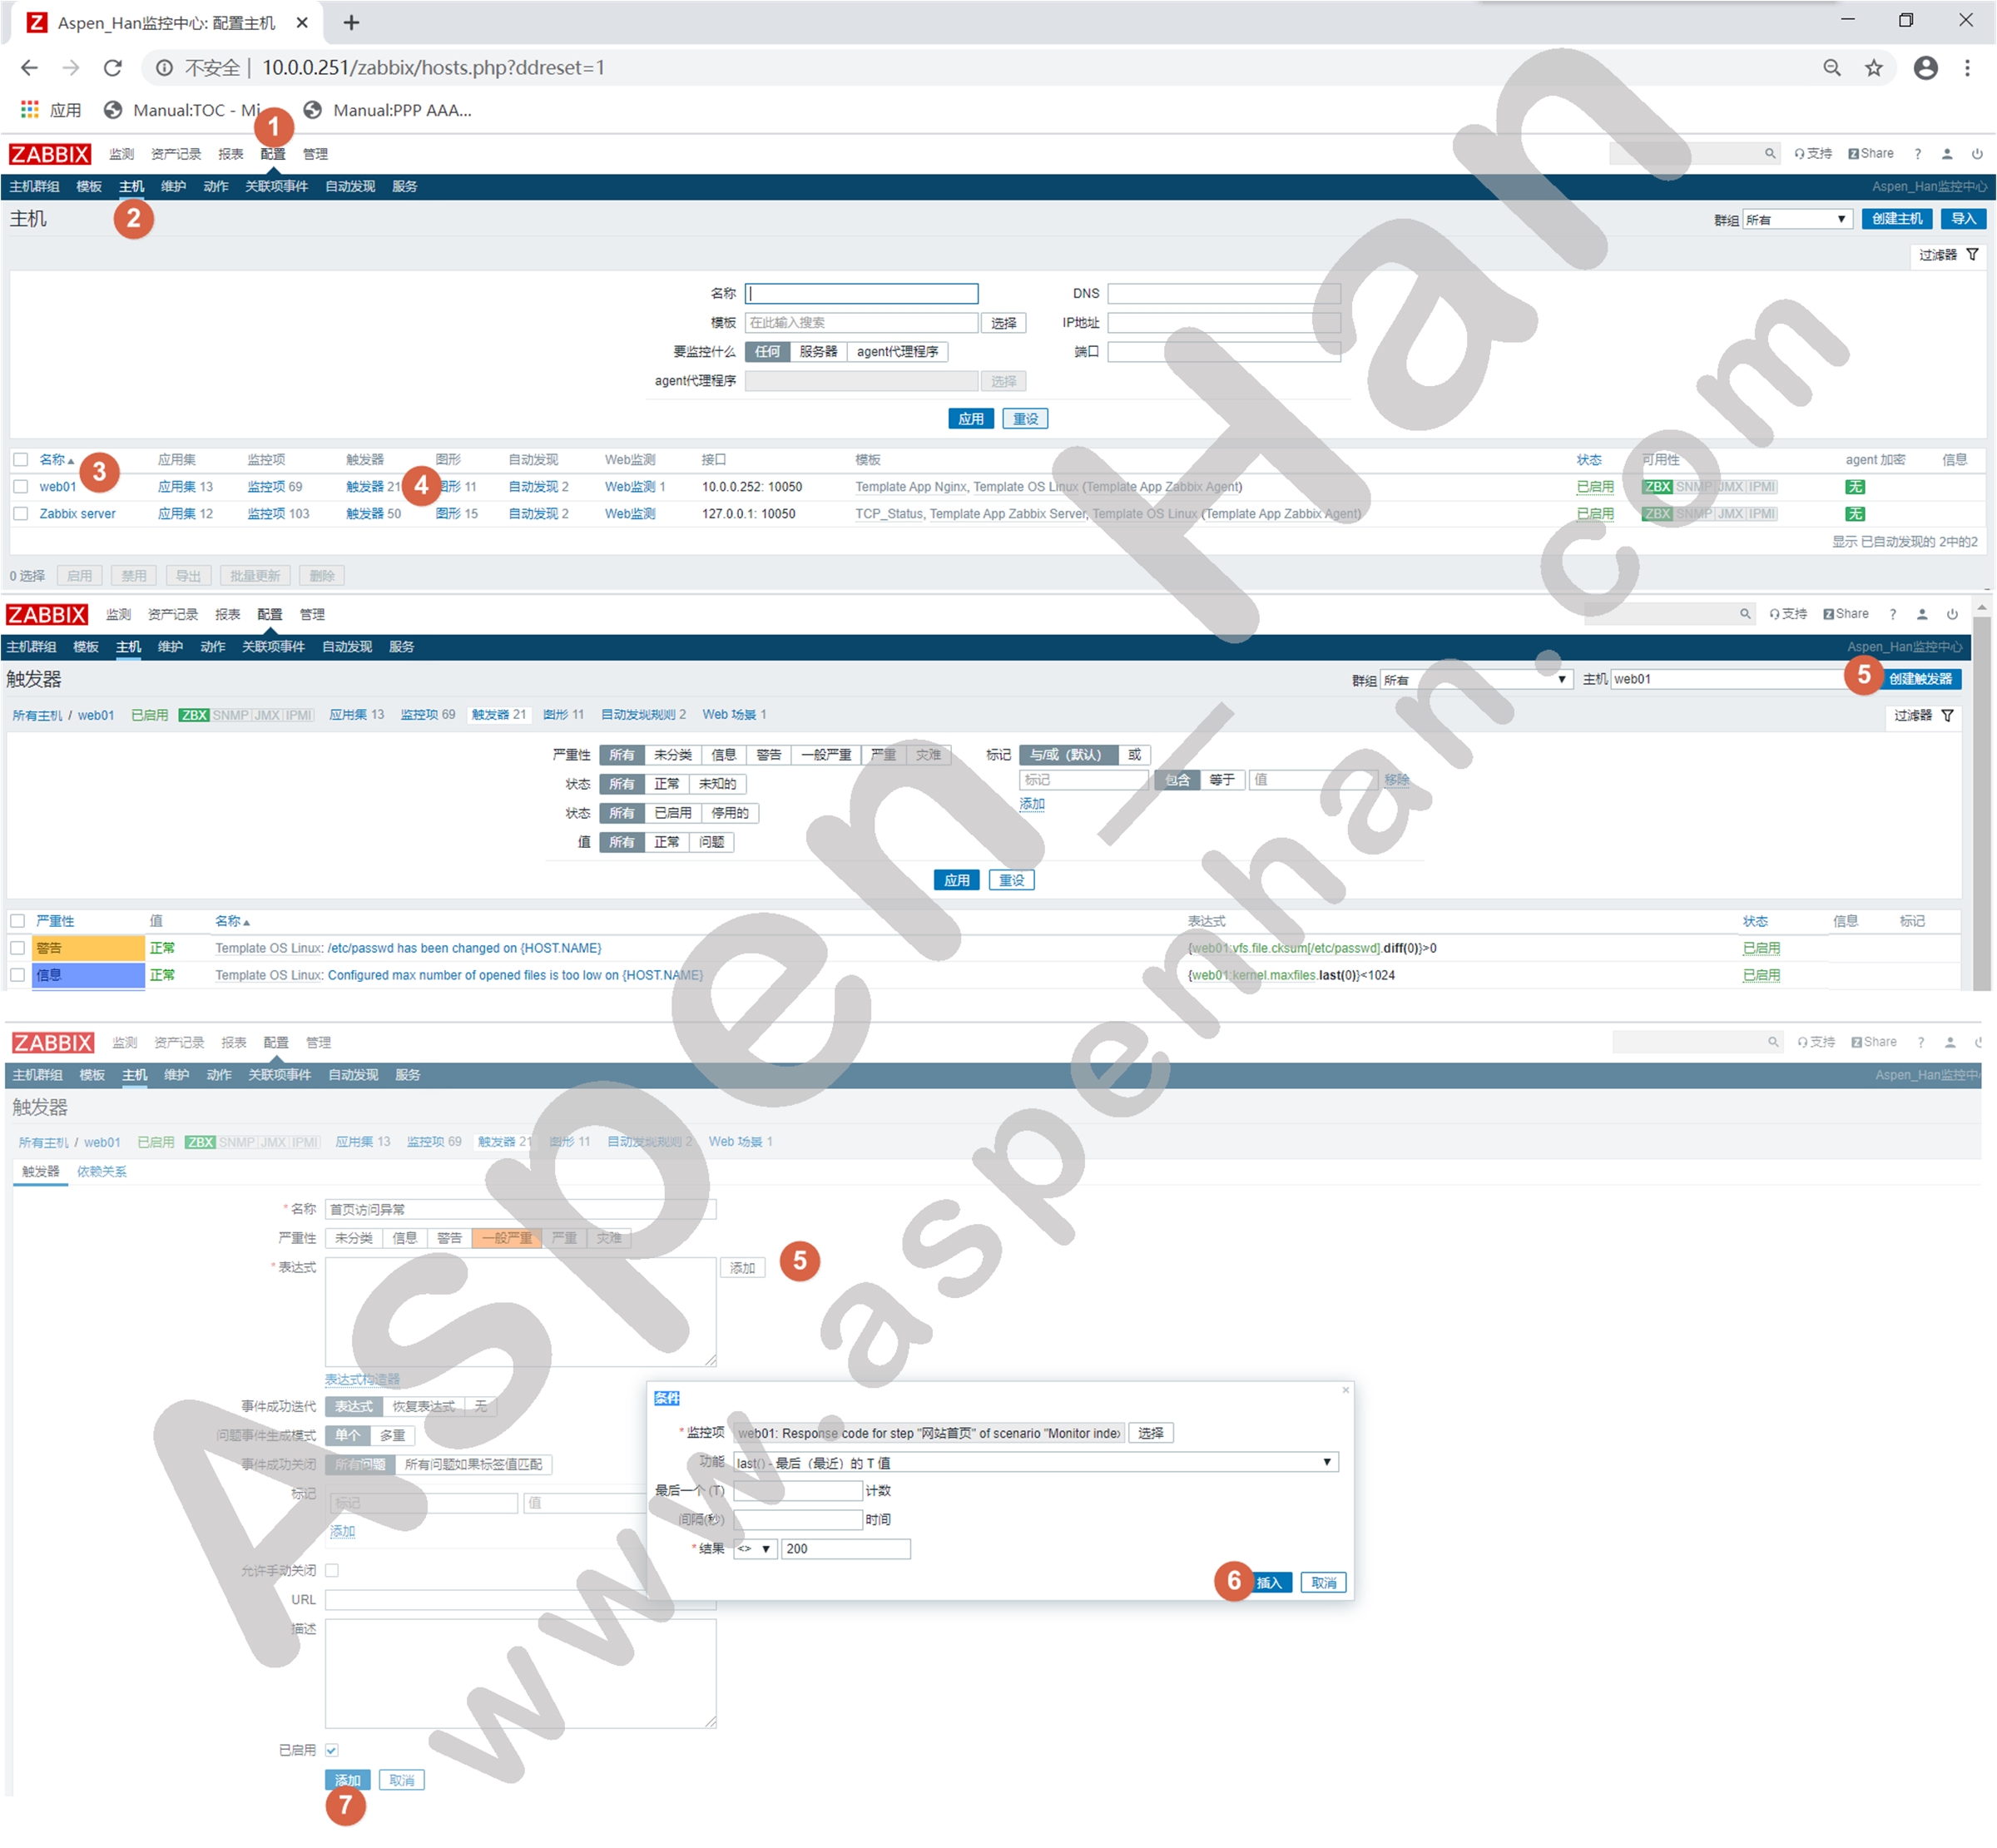
step 4 结合触发器
| 配置 -> 主机 -> 特定主机 -> 触发器 -> 创建触发器 |
2.基于Percona插件的MySQL监控
step 1 安装percona插件
| rpm -ivh 安装包 |
[root@db01 ~]# rz -E
rz waiting to receive.
[root@db01 ~]# ls
anaconda-ks.cfg  percona-zabbix-templates-1.1.8-1.noarch.rpm
[root@db01 ~]# rpm -ivh percona-zabbix-templates-1.1.8-1.noarch.rpm
warning: percona-zabbix-templates-1.1.8-1.noarch.rpm: Header V4 DSA/SHA1 Signature, key ID cd2efd2a: NOKEY
Preparing...                          ################################# [100%]
Updating / installing...
   1:percona-zabbix-templates-1.1.8-1 ################################# [100%]

Scripts are installed to /var/lib/zabbix/percona/scripts
Templates are installed to /var/lib/zabbix/percona/templates
step 2 导入模版
| 不同版本的Zabbix模版相互不兼容 |
| 配置 -> 模板 -> 导入 |
模版下载地址 提取码:cj9x
官方安装包自带的模版适用于Zabbix 2.2版本
step 3 导入监控项
|
mv /var/lib/zabbix/percona/templates/userparameter_percona_mysql.conf /etc/zabbix/zabbix_agentd.d/ systemctl restart zabbix-agent |
[root@db01 ~]# cd /var/lib/zabbix/percona/templates/
[root@db01 /var/lib/zabbix/percona/templates]# ls
userparameter_percona_mysql.conf
zabbix_agent_template_percona_mysql_server_ht_2.0.9-sver1.1.8.xml
[root@db01 /var/lib/zabbix/percona/templates]# mv userparameter_percona_mysql.conf /etc/zabbix/zabbix_agentd.d/
[root@db01 /var/lib/zabbix/percona/templates]# cd /etc/zabbix/zabbix_agentd.d/
[root@db01 /etc/zabbix/zabbix_agentd.d]# ls
userparameter_mysql.conf  userparameter_percona_mysql.conf
[root@db01 /etc/zabbix/zabbix_agentd.d]# systemctl restart zabbix-agent.service
step 4 手动测试监控脚本
| 调用php脚本依赖php和php-mysql软件包 |
[root@db01 /etc/zabbix/zabbix_agentd.d]# tail -3 userparameter_percona_mysql.conf
UserParameter=MySQL.Open-files,/var/lib/zabbix/percona/scripts/get_mysql_stats_wrapper.sh ij
UserParameter=MySQL.State-closing-tables,/var/lib/zabbix/percona/scripts/get_mysql_stats_wrapper.sh lq
UserParameter=MySQL.running-slave,/var/lib/zabbix/percona/scripts/get_mysql_stats_wrapper.sh running-slave
[root@db01 /etc/zabbix/zabbix_agentd.d]# sh -x /var/lib/zabbix/percona/scripts/get_mysql_stats_wrapper.sh ij
[root@db01 /etc/zabbix/zabbix_agentd.d]# /usr/bin/php -q /var/lib/zabbix/percona/scripts/ss_get_mysql_stats.php --host localhost --items gg
ERROR: Can't connect to local MySQL server through socket '/var/lib/mysql/mysql.sock' (2)
[root@db01 /etc/zabbix/zabbix_agentd.d]# grep -E '^\$mysql.*' /var/lib/zabbix/percona/scripts/ss_get_mysql_stats.php | head -4
$mysql_user = 'root';
$mysql_pass = '123';
$mysql_port = 3306;
$mysql_socket = '/tmp/mysql.sock';
[root@db01 /etc/zabbix/zabbix_agentd.d]# /usr/bin/php -q /var/lib/zabbix/percona/scripts/ss_get_mysql_stats.php --host localhost --items gg
gg:6
[root@db01 /etc/zabbix/zabbix_agentd.d]# /var/lib/zabbix/percona/scripts/get_mysql_stats_wrapper.sh ij
17
[root@db01 /etc/zabbix/zabbix_agentd.d]# cd /tmp/
[root@db01 /tmp]# rm -rf localhost-mysql_cacti_stats.txt
step 5 手动测试监控项(Server端)
| zabbix_get -s IP地址 -k 监控项 |
[root@zabbix-server /]# zabbix_get -s 10.0.0.151 -k MySQL.Open-files
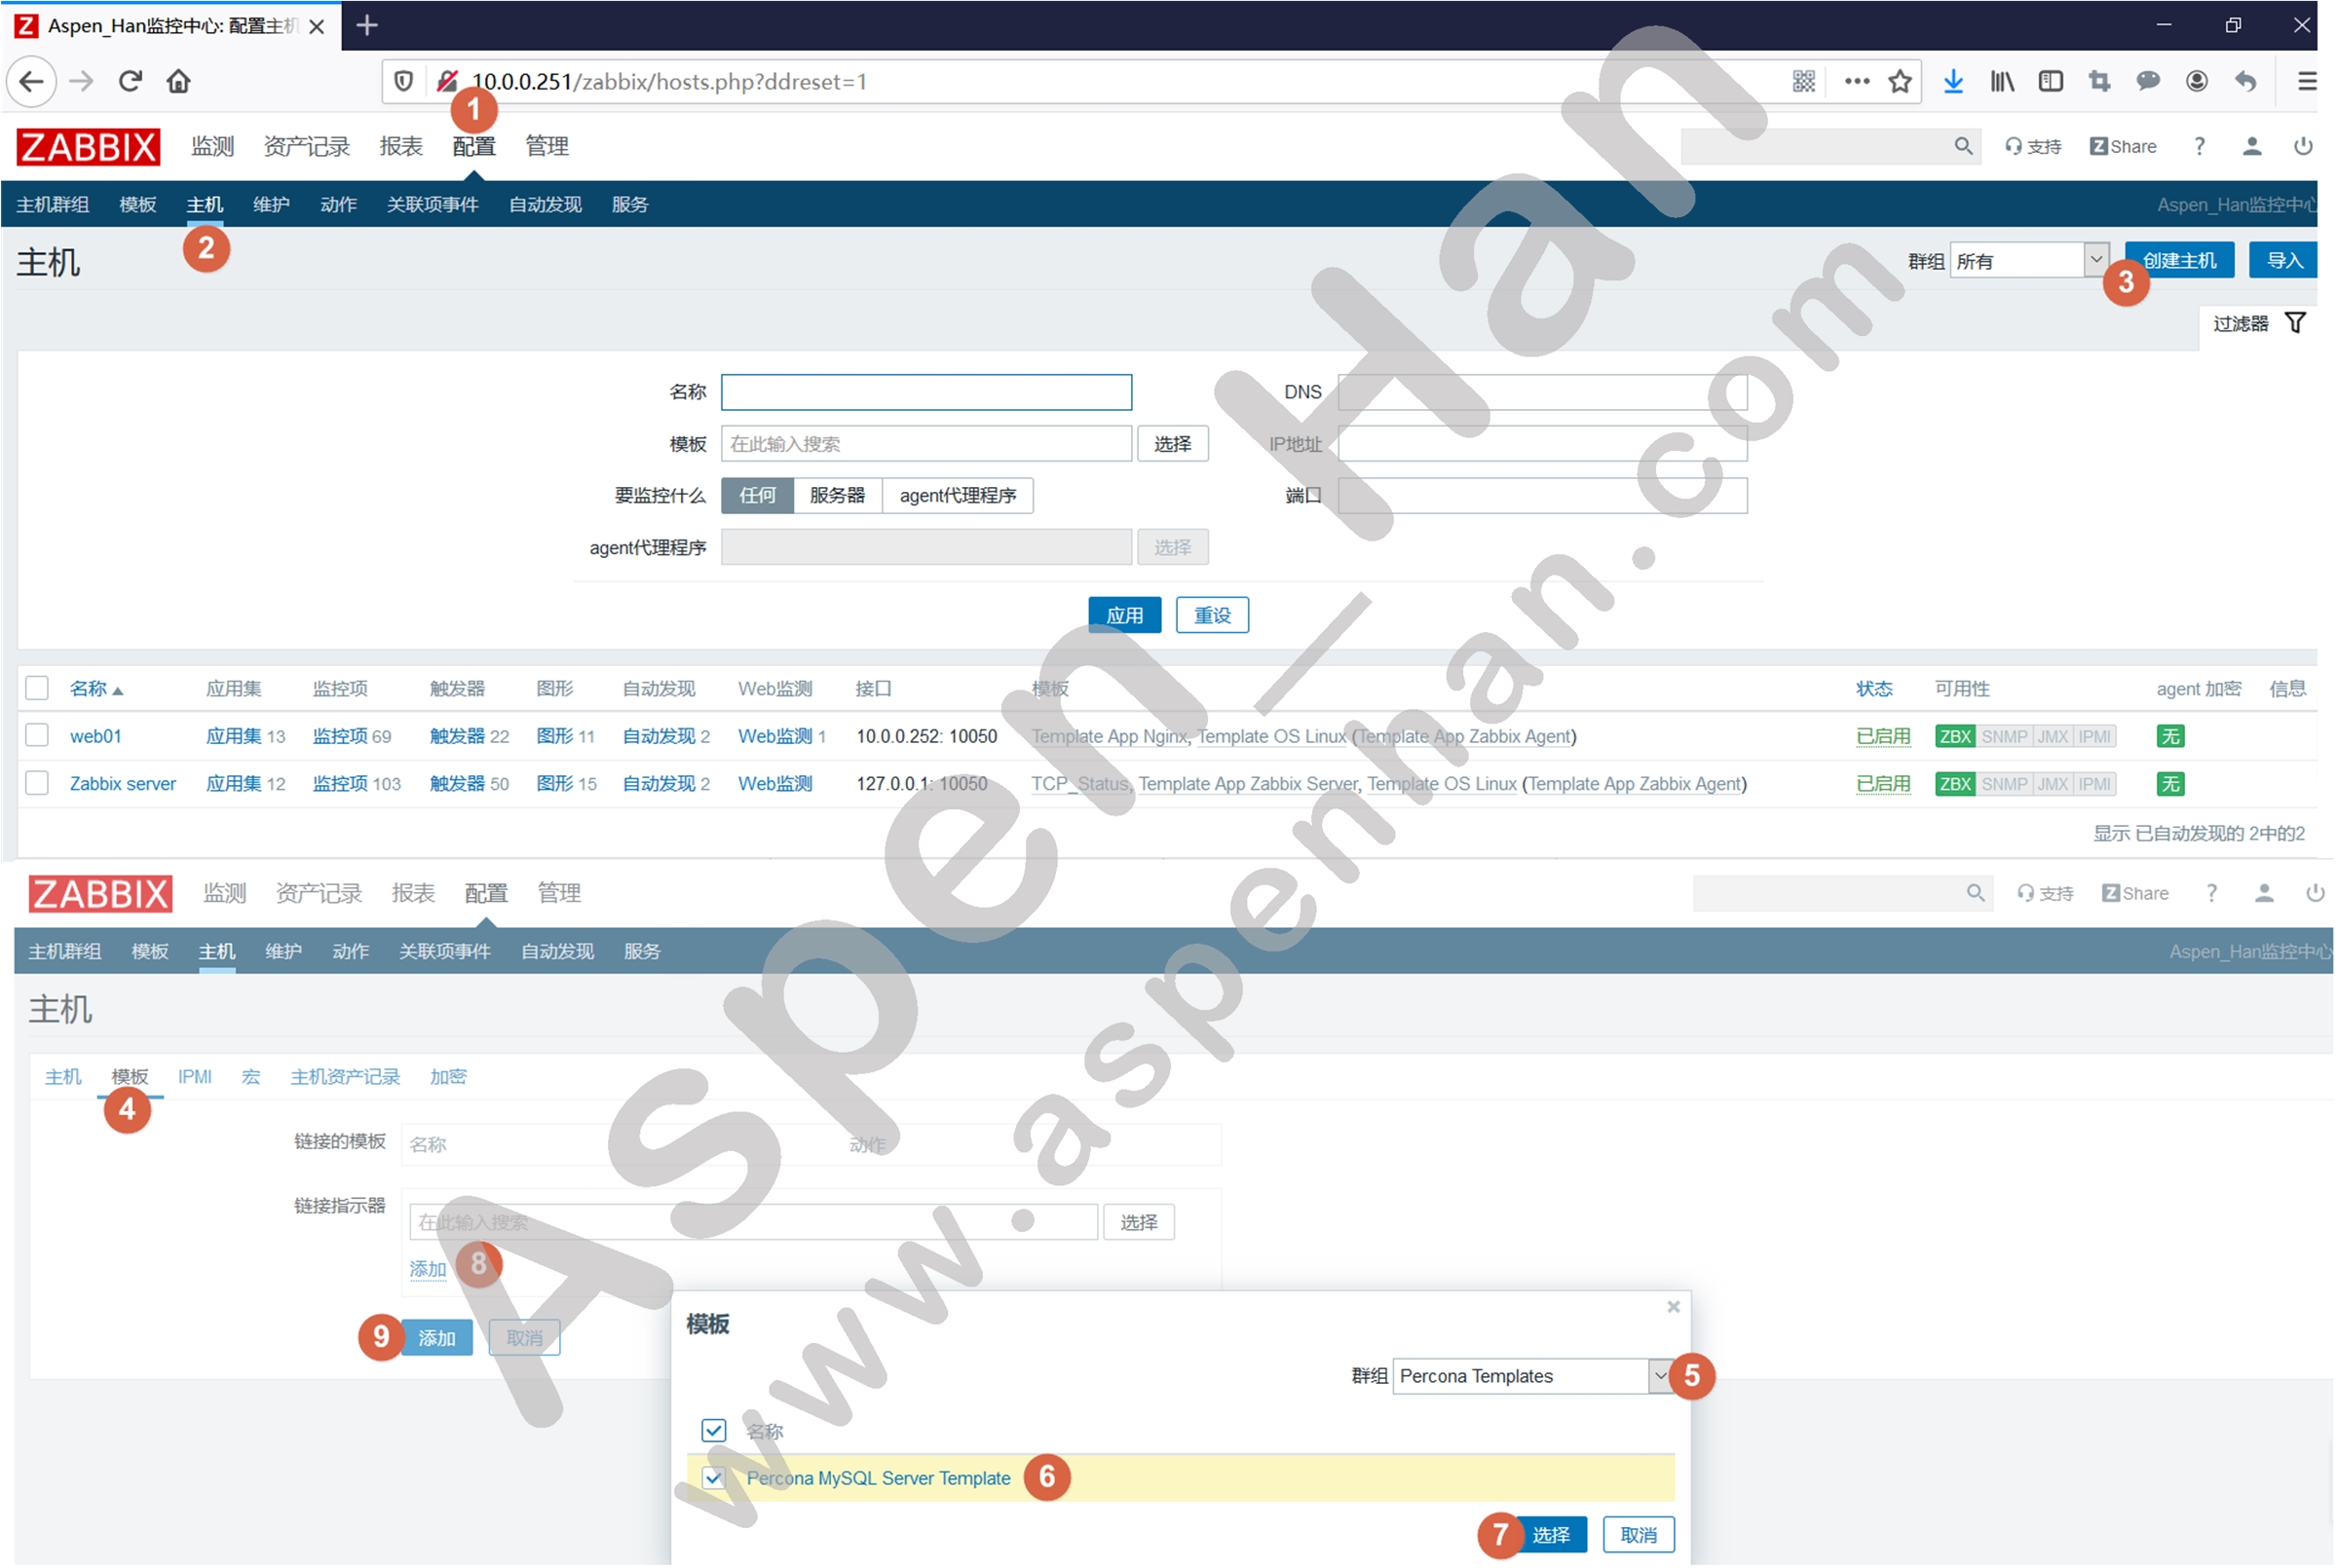
17step 6 目标主机关联模板
| 配置 -> 主机 -> 特定主机 -> 模板 |
step 7 禁用无关监控项
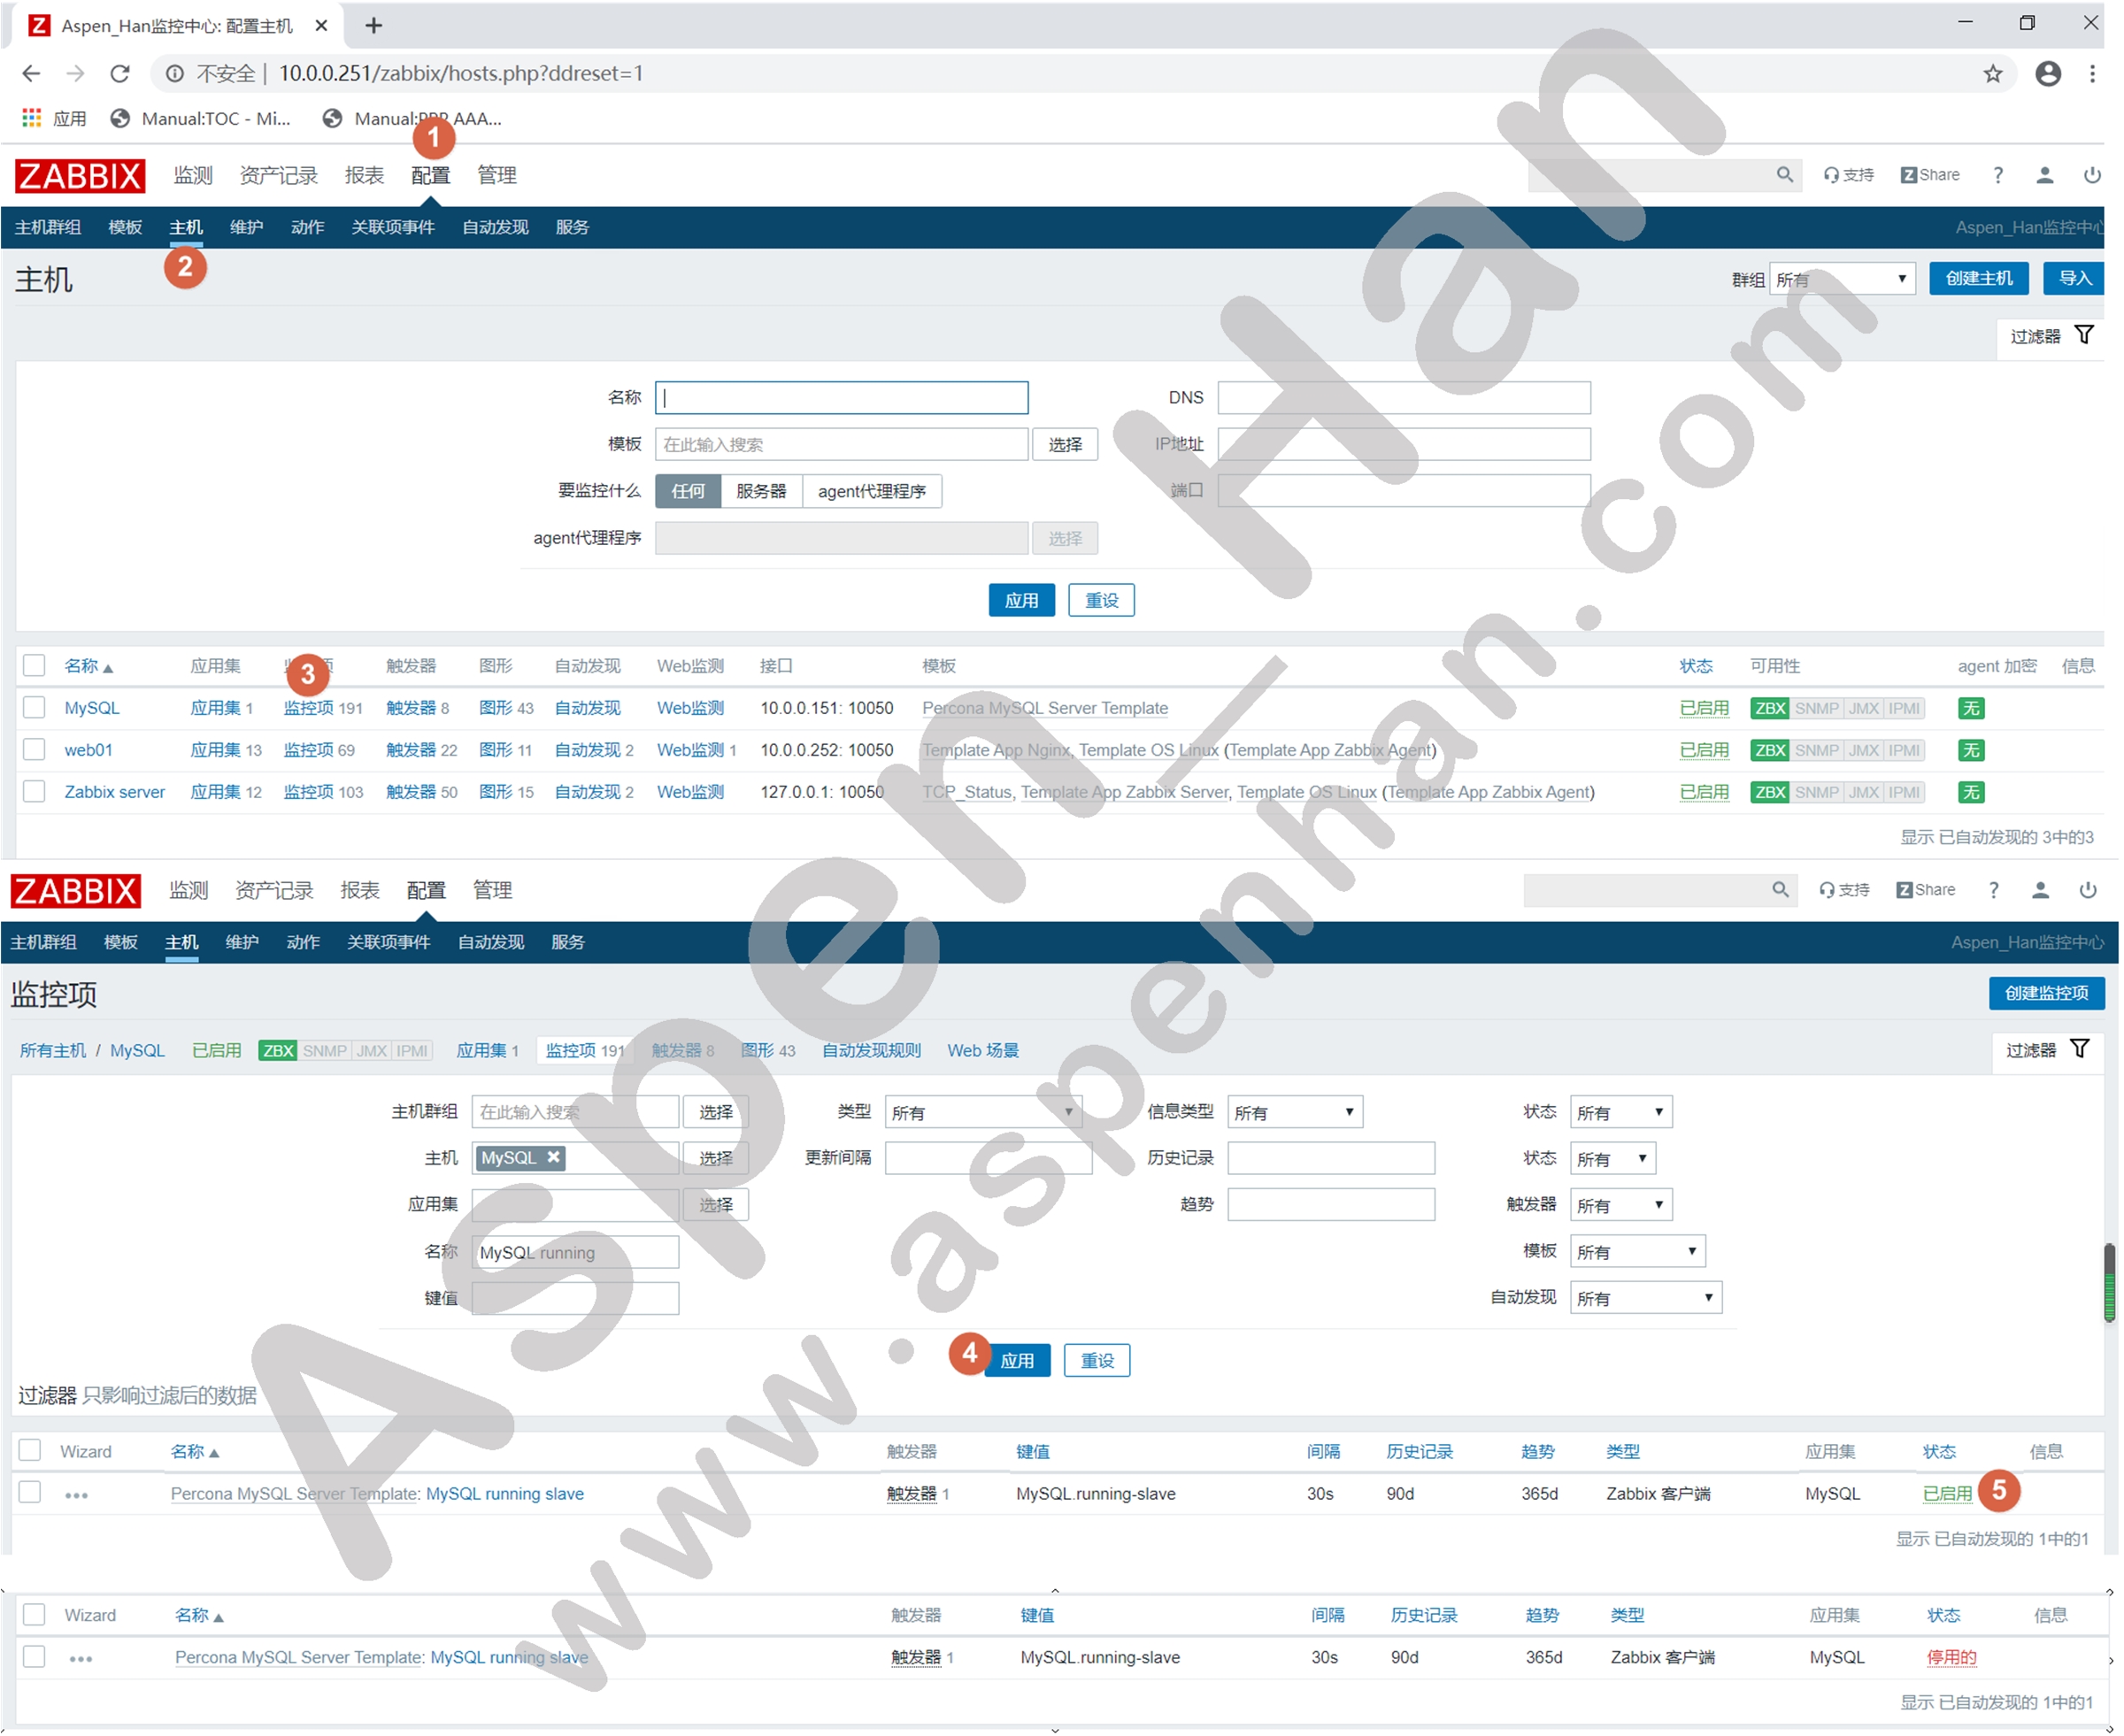
该监控项附录
[root@db01 ~]# sed -n 19p /var/lib/zabbix/percona/scripts/get_mysql_stats_wrapper.sh
    RES=`HOME=~zabbix /application/mysql/bin/mysql -uroot -p123 -e 'SHOW SLAVE STATUS\G' 2>/dev/null | egrep '(Slave_IO_Running|Slave_SQL_Running):' | awk -F: '{print $2}' | tr '\n' ','`

#监控编译安装的Mysql需使用mysql命令的绝对路径,请注意命令执行有错误提示时,要将错误提示重定向到空;
六、SNMP与JMX监控
1. 基于SNMP监控Linux
SNMP默认端口号:161(UDP)
被监控设备:开启SNMP服务端
Zabbix-Server:开启SNMP客户端
| 版本 | 特性 |
|---|---|
| v1 | 无口令验证 |
| v2c | 支持基于社区名的口令验证 |
| v3 | 提供认证、隐私、访问控制等服务 |
|
snmpwalk -v 版本 -c 社区名 IP地址 OID #查询指定设备的OID信息 snmpwalk命令软件包:net-snmp-utils.x86_64 |

[root@zabbix-server ~]# snmpwalk -v2c -c aspen_han 10.0.0.128 1.3.6.1.2.1.25.2.2.0
HOST-RESOURCES-MIB::hrMemorySize.0 = INTEGER: 3145208 KBytes- 被监控端(以Linux服务器为例)
step 1 安装snmp服务端
| yum -y install net-snmp |
[root@zabbix-web ~]# yum install -y net-snmp.x86_64
Loaded plugins: fastestmirror
......
Dependency Installed:
  net-snmp-agent-libs.x86_64 1:5.7.2-43.el7_7.3         net-snmp-libs.x86_64 1:5.7.2-43.el7_7.3

Complete!
step 2 配置社区名称
|
#/etc/snmp/snmp.conf com2sec notConfigUser default 社区名 #默认社区名是public |
[root@zabbix-web ~]# grep com2sec /etc/snmp/snmpd.conf | grep -v '^#'
com2sec notConfigUser  default       private
step 3 启动snmp服务
| systemctl start snmpd |
[root@zabbix-web ~]# systemctl start snmpd
[root@zabbix-web ~]# netstat -lnup
Active Internet connections (only servers)
Proto Recv-Q Send-Q Local Address           Foreign Address         State       PID/Program name
udp        0      0 0.0.0.0:161             0.0.0.0:*                           111717/snmpd
step 4 测试取值
监控端测试
| snmpwalk -v2c -c 社区名 IP地址 |
[root@zabbix-server ~]# snmpwalk -v 2c -c private 10.0.0.252|head -5
SNMPv2-MIB::sysDescr.0 = STRING: Linux zabbix-web 3.10.0-957.el7.x86_64 #1 SMP Thu Nov 8 23:39:32 UTC 2018 x86_64
SNMPv2-MIB::sysObjectID.0 = OID: NET-SNMP-MIB::netSnmpAgentOIDs.10
DISMAN-EVENT-MIB::sysUpTimeInstance = Timeticks: (14625) 0:02:26.25
SNMPv2-MIB::sysContact.0 = STRING: Root <root@localhost> (configure /etc/snmp/snmp.local.conf)
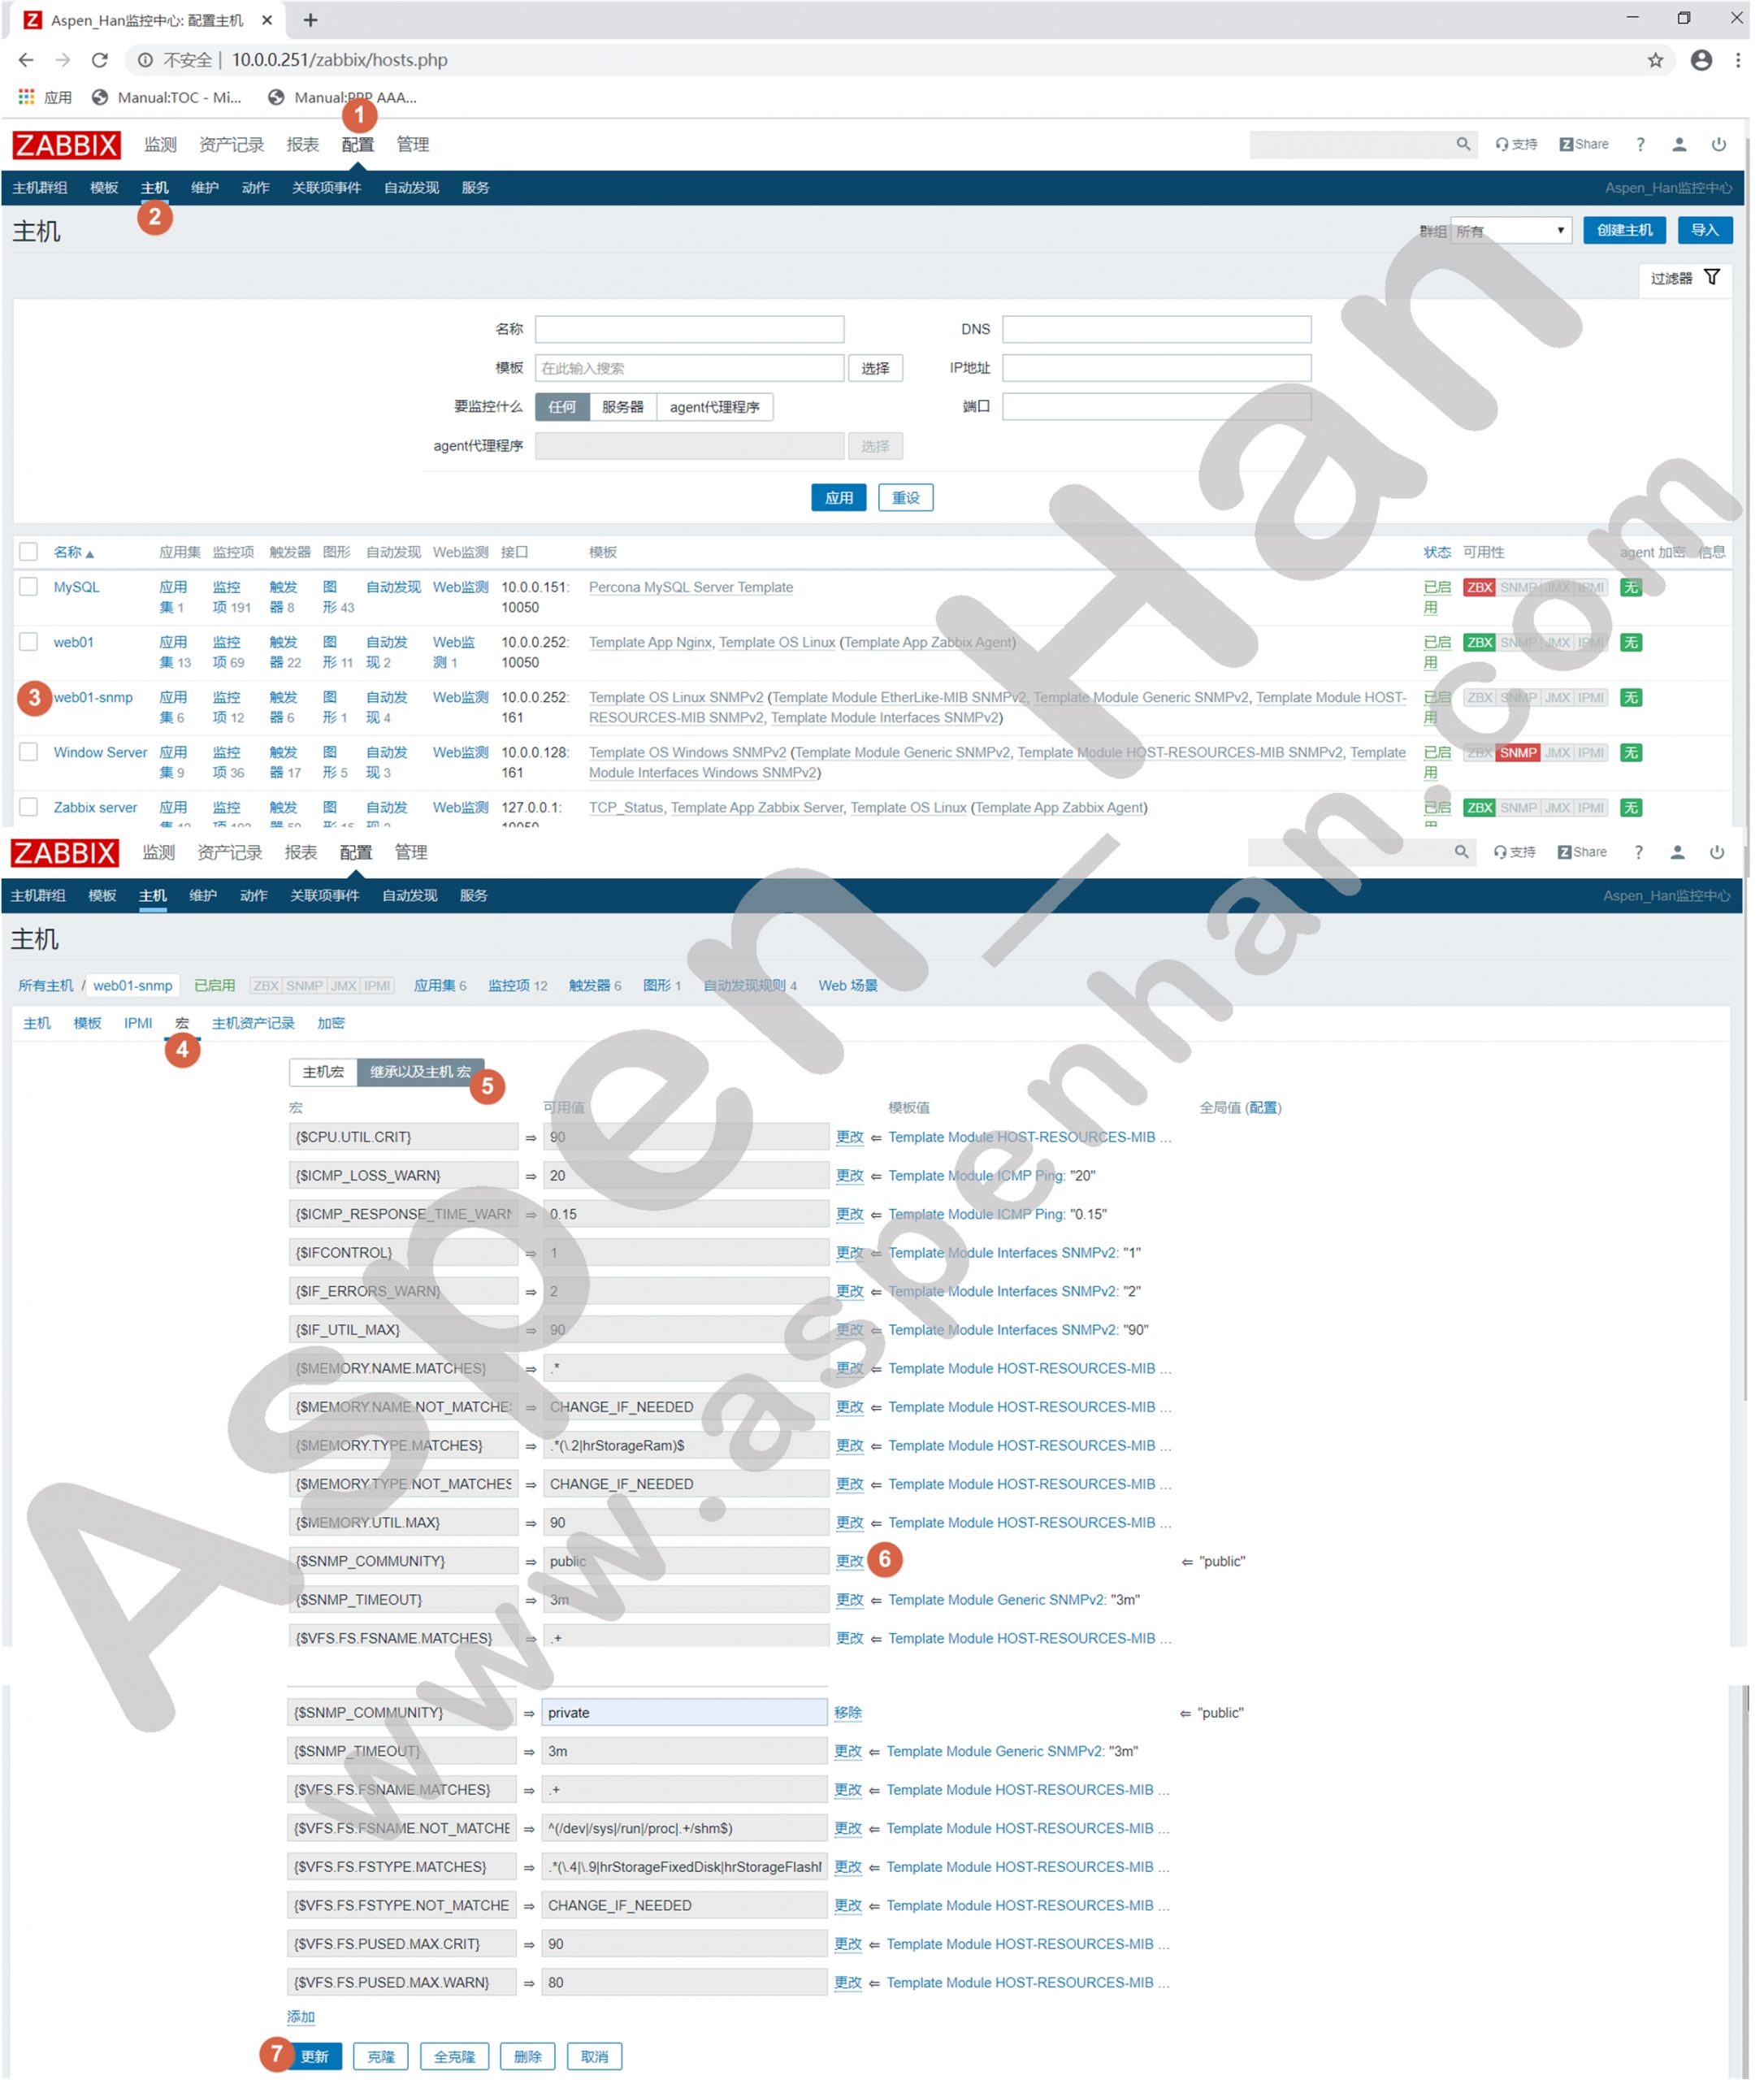
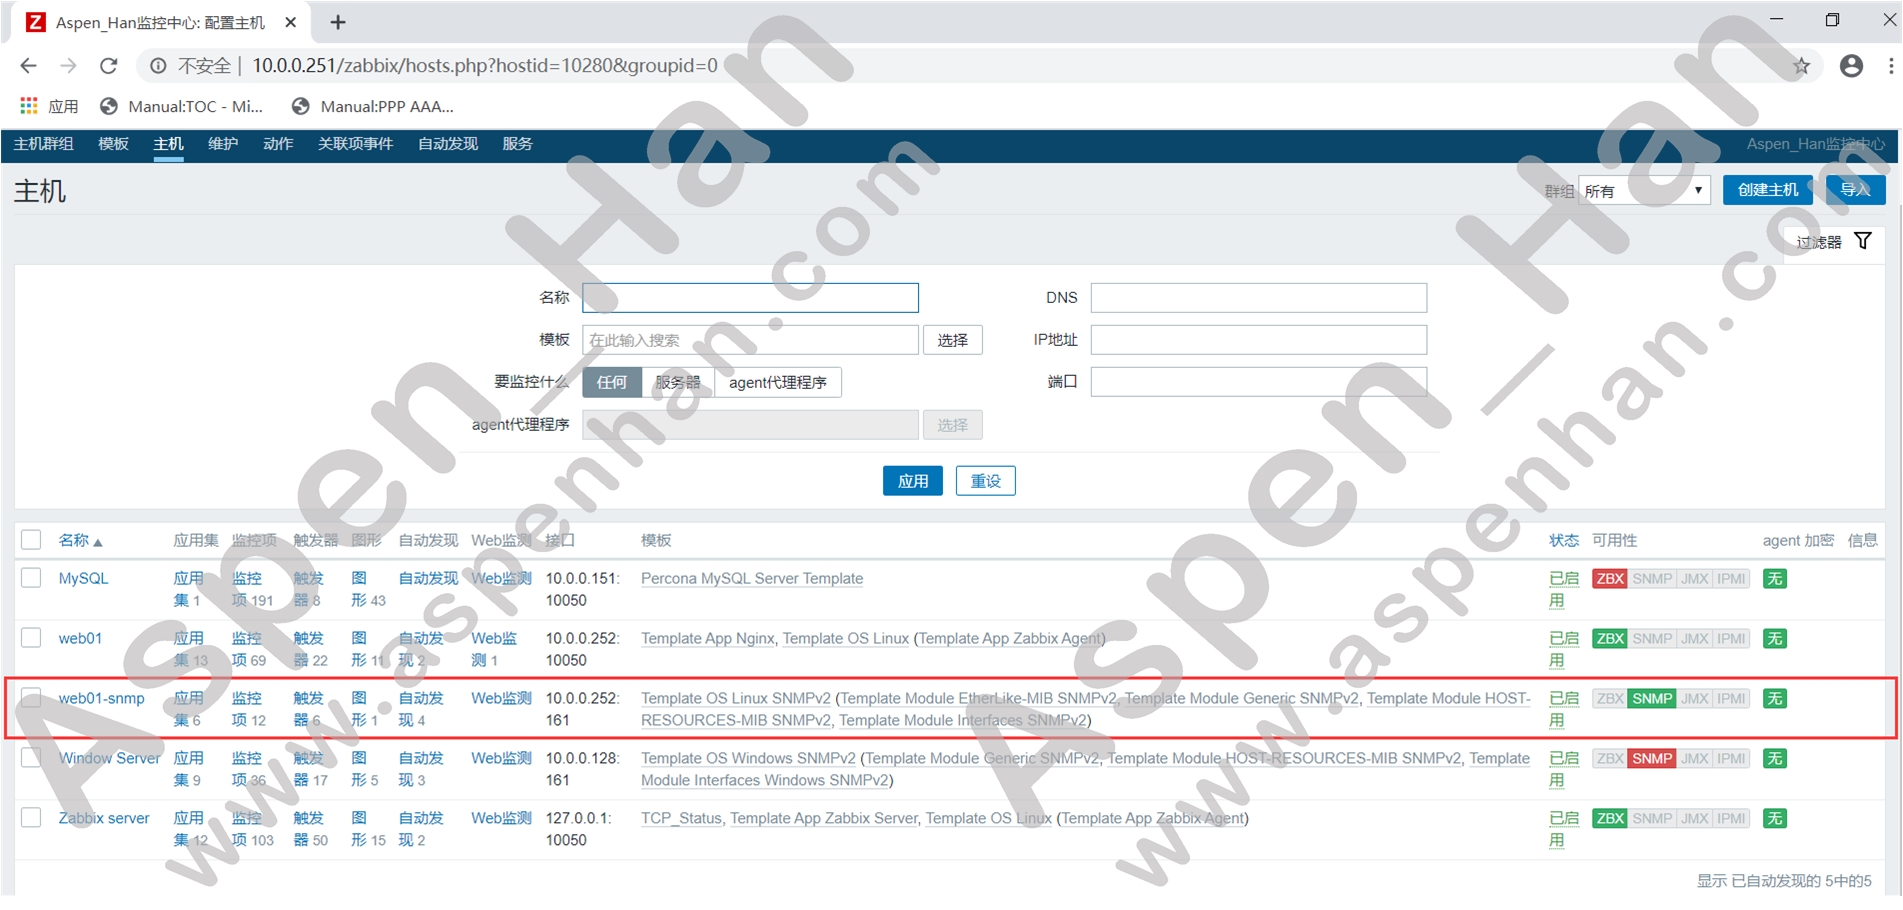
SNMPv2-MIB::sysName.0 = STRING: zabbix-web- 监控端
step 1 创建监控主机
| 配置 -> 主机 -> 创建主机 -> 主机 |
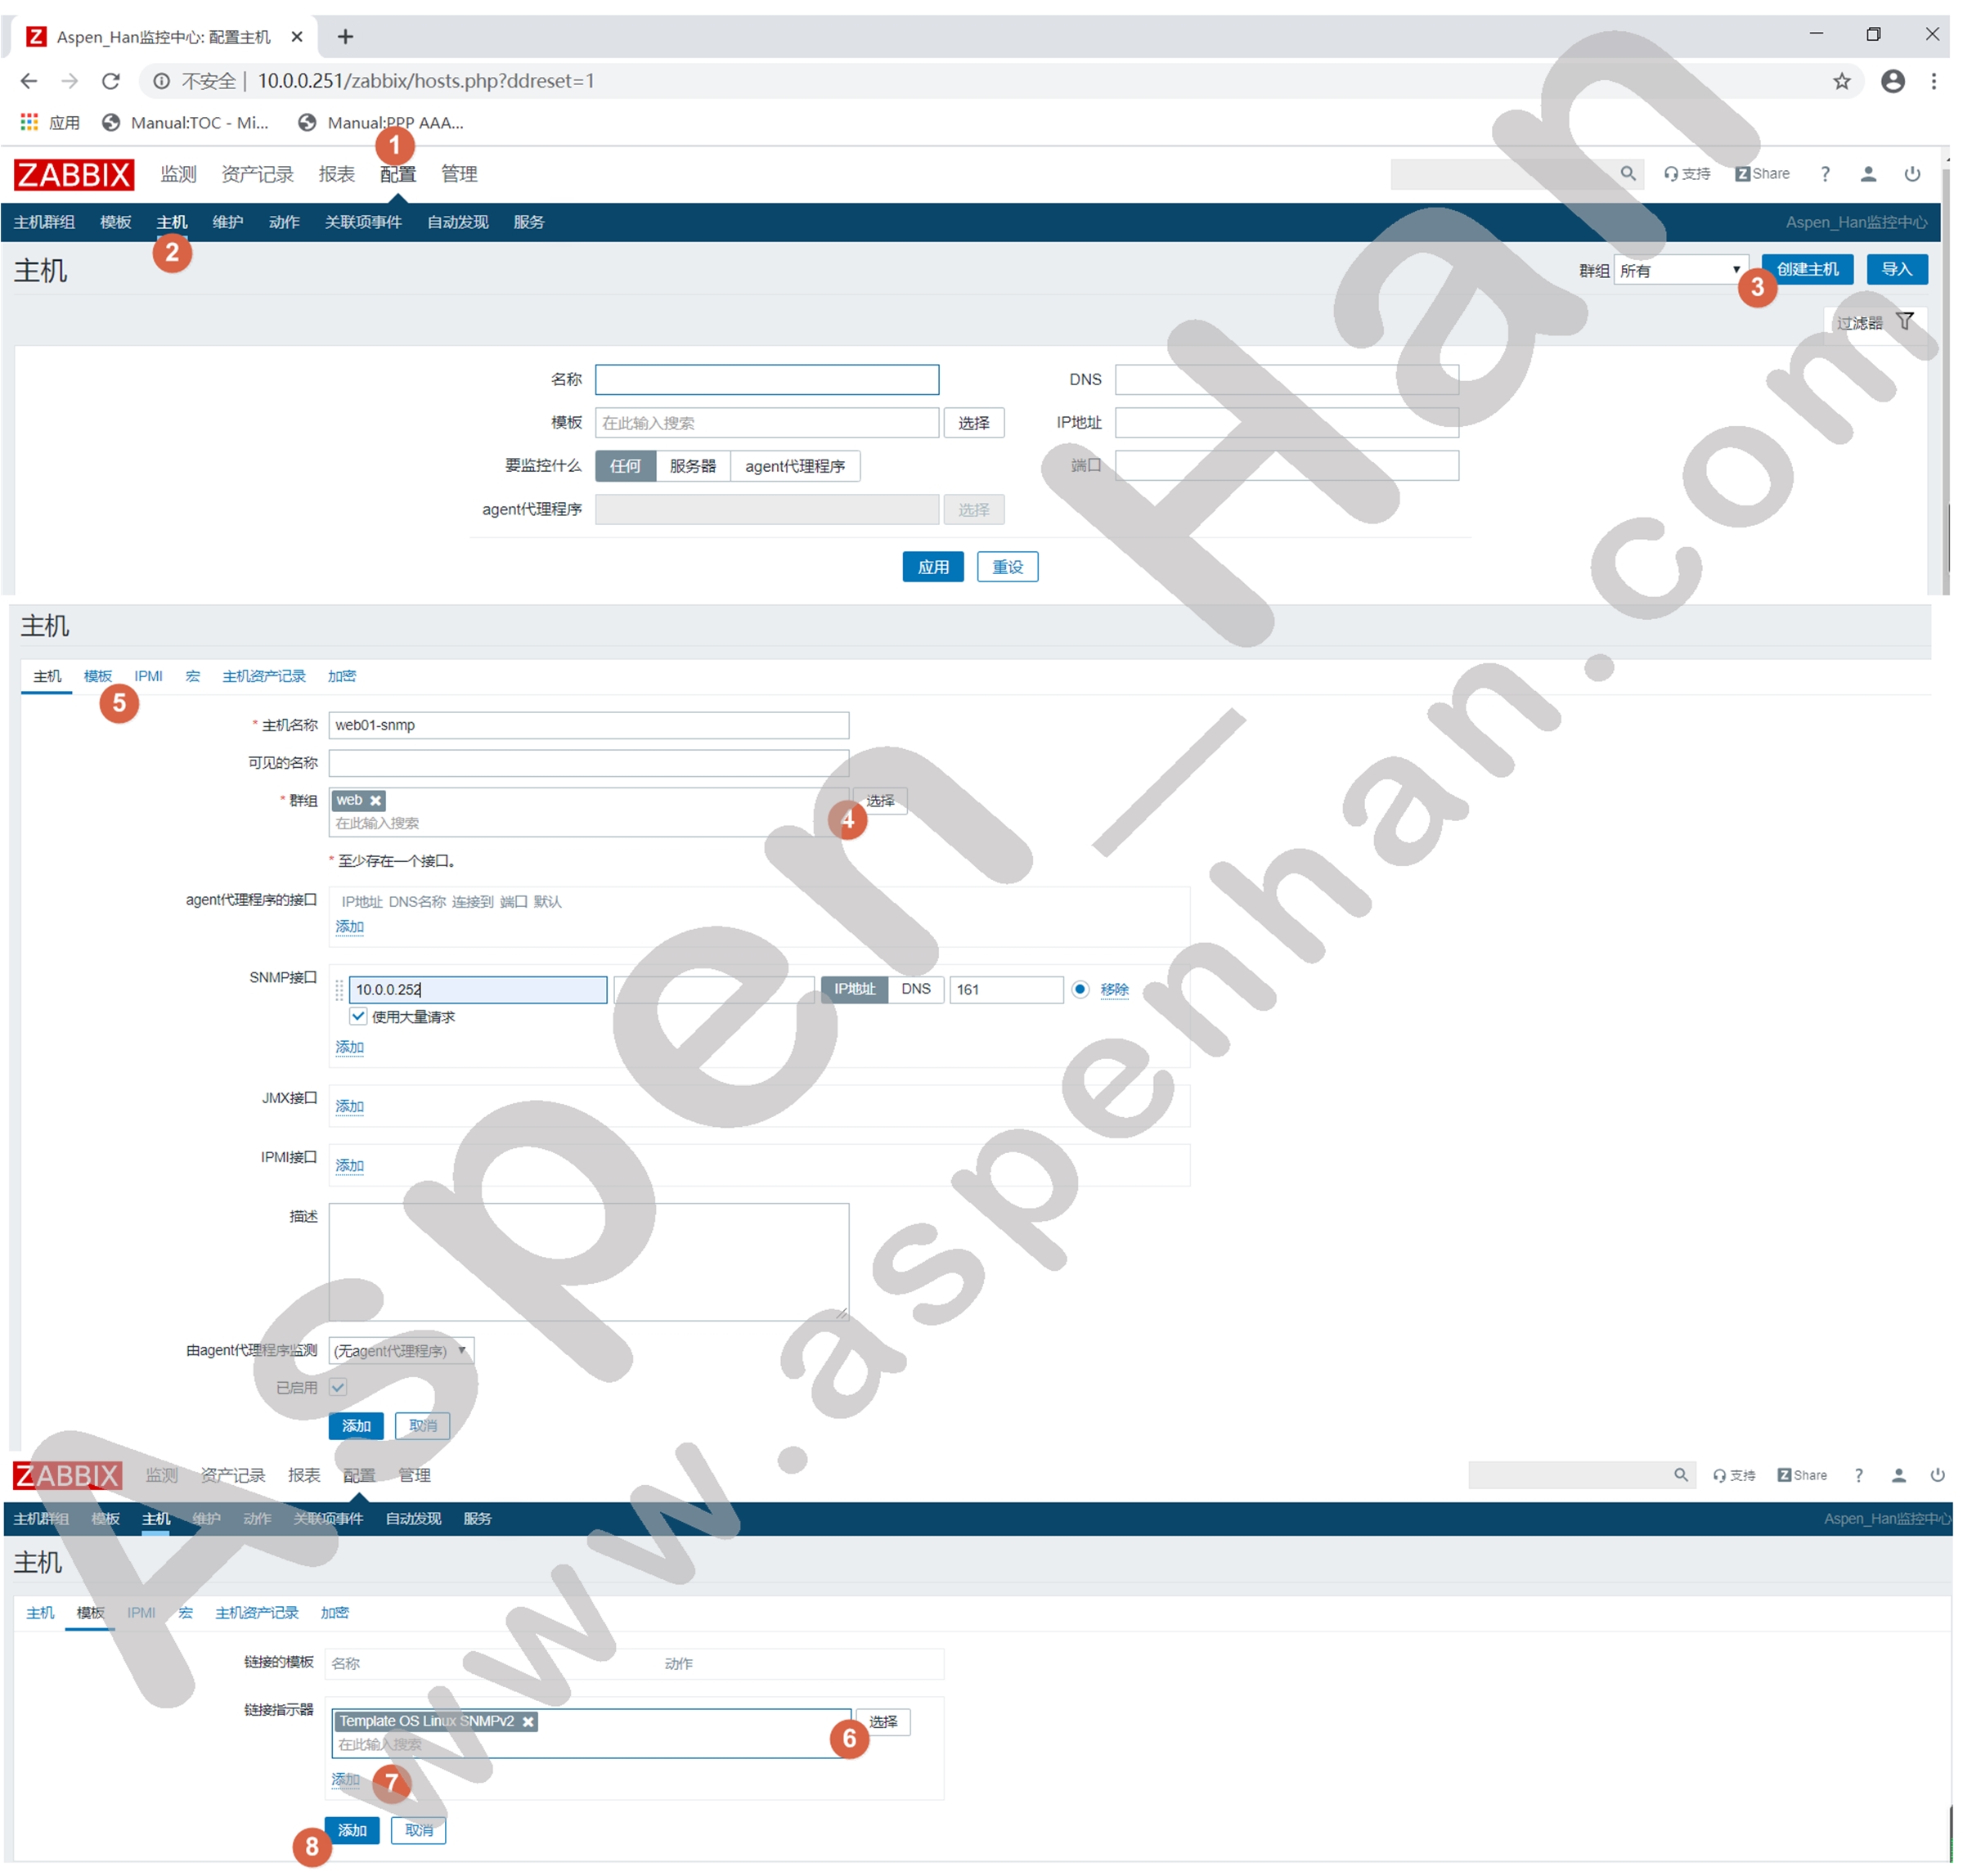
step 2 更改社区名
| 配置 -> 主机 -> 特定主机 -> 宏 |
2. 基于JMX监控JVM
| JVM监控的重要指标之一就是内存(堆内存与非堆内存) |
本文以监控Tomcat为例
Tomcat服务部署详见:Tomcat服务
step 1 开启Tomcat远程监控服务
|
#bin/catalina.sh CATALINA_OPTS="$CATALINA_OPTS -Dcom.sun.management.jmxremote #开启jmx远程管理服务 -Djava.rmi.server.hostname=IP地址 #指定本机管理IP地址 -Dcom.sun.management.jmxremote.port=端口 #指定jmx监听端口(默认端口12345) -Dcom.sun.management.jmxremote.ssl=false #禁用SSL -Dcom.sun.management.jmxremote.authenticate=false"#禁用认证功能 |
[root@tomcat ~]# awk 'NR==112,NR==117' /application/tomcat/bin/catalina.sh
CATALINA_OPTS="$CATALINA_OPTS  \
-Dcom.sun.management.jmxremote \
-Dcom.sun.management.jmxremote.port=12345 \
-Dcom.sun.management.jmxremote.ssl=false \
-Dcom.sun.management.jmxremote.authenticate=false \
-Djava.rmi.server.hostname=10.0.0.252"
step 2 重启Tomcat服务
|
bin/shutdown.sh bin/startup.sh |
[root@tomcat ~]# /application/tomcat/bin/shutdown.sh
Using CATALINA_BASE:   /application/tomcat
Using CATALINA_HOME:   /application/tomcat
Using CATALINA_TMPDIR: /application/tomcat/temp
Using JRE_HOME:        /application/jdk
Using CLASSPATH:       /application/tomcat/bin/bootstrap.jar:/application/tomcat/bin/tomcat-juli.jar
[root@tomcat ~]# ss -lntu
Netid State      Recv-Q Send-Q Local Address:Port               Peer Address:Port
tcp   LISTEN     0      128             *:22                          *:*
tcp   LISTEN     0      100     127.0.0.1:25                          *:*
tcp   LISTEN     0      80             :::3306                       :::*
tcp   LISTEN     0      128            :::22                         :::*
tcp   LISTEN     0      100           ::1:25                         :::*
[root@tomcat ~]# /application/tomcat/bin/startup.sh
Using CATALINA_BASE:   /application/tomcat
Using CATALINA_HOME:   /application/tomcat
Using CATALINA_TMPDIR: /application/tomcat/temp
Using JRE_HOME:        /application/jdk
Using CLASSPATH:       /application/tomcat/bin/bootstrap.jar:/application/tomcat/bin/tomcat-juli.jar
Tomcat started.
step 3 安装JMX
| yum install -y zabbix-java-gateway |
[root@zabbix-server ~]# yum install -y zabbix-java-gateway.x86_64
Loaded plugins: fastestmirror
......
  python-javapackages.noarch 0:3.4.1-11.el7
  python-lxml.x86_64 0:3.2.1-4.el7
  tzdata-java.noarch 0:2019c-1.el7

Complete!
step 4 配置JMX
|
#/etc/zabbix/zabbix_java_gateway.conf START_POLLERS=n #指定采集器开启数量 |
| 启动的进程数量越多,占用系统的内存越大; |
[root@zabbix-server ~]# grep -Ev '^$|#' /etc/zabbix/zabbix_java_gateway.conf
PID_FILE="/var/run/zabbix/zabbix_java.pid"
START_POLLERS=5
step 5 启动JMX
| systemctl start zabbix-java-gateway.service |
[root@zabbix-server ~]# systemctl start  zabbix-java-gateway.service
[root@zabbix-server ~]# systemctl status  zabbix-java-gateway.service
● zabbix-java-gateway.service - Zabbix Java Gateway
   Loaded: loaded (/usr/lib/systemd/system/zabbix-java-gateway.service; disabled; vendor preset: disabled)
   Active: active (running) since Wed 2020-03-04 10:15:37 CST; 6s ago
  Process: 31985 ExecStart=/usr/sbin/zabbix_java_gateway (code=exited, status=0/SUCCESS)
 Main PID: 31988 (java)
   CGroup: /system.slice/zabbix-java-gateway.service
           └─31988 java -server -Dlogback.configurationFile=/etc/zabbix/zabbix_java_gate...

Mar 04 10:15:37 zabbix-server systemd[1]: Starting Zabbix Java Gateway...
Mar 04 10:15:37 zabbix-server systemd[1]: Started Zabbix Java Gateway.
step 6 配置Zabbix-Server
|
# /etc/zabbix/zabbix_server.conf DBHost=IP地址 #指定数据库用户登录授权主机地址 DBName=数据库名称 #指定连接数据库名称 DBUser=数据库用户 #指定连接数据库用户名 DBPassword=数据库密码 #指定连接数据库密码 JavaGateWay=IP地址 #指定JMX的IP地址 JavaGateWayPort=端口 #指定JMX服务的端口(默认端口10052) StartJavaPollers=n #指定采集器开启数量(需与JMX配置文件一致) |
[root@zabbix-server ~]# grep -Ev '#' /etc/zabbix/zabbix_server.conf| grep -Ei 'Java|DB'
DBHost=localhost
DBName=zabbix
DBUser=zabbix
DBPassword=123456
JavaGateway=127.0.0.1
JavaGatewayPort=10052
StartJavaPollers=5
step 7 重启Zabbix-Server
| systemctl restart zabbix-server.service |
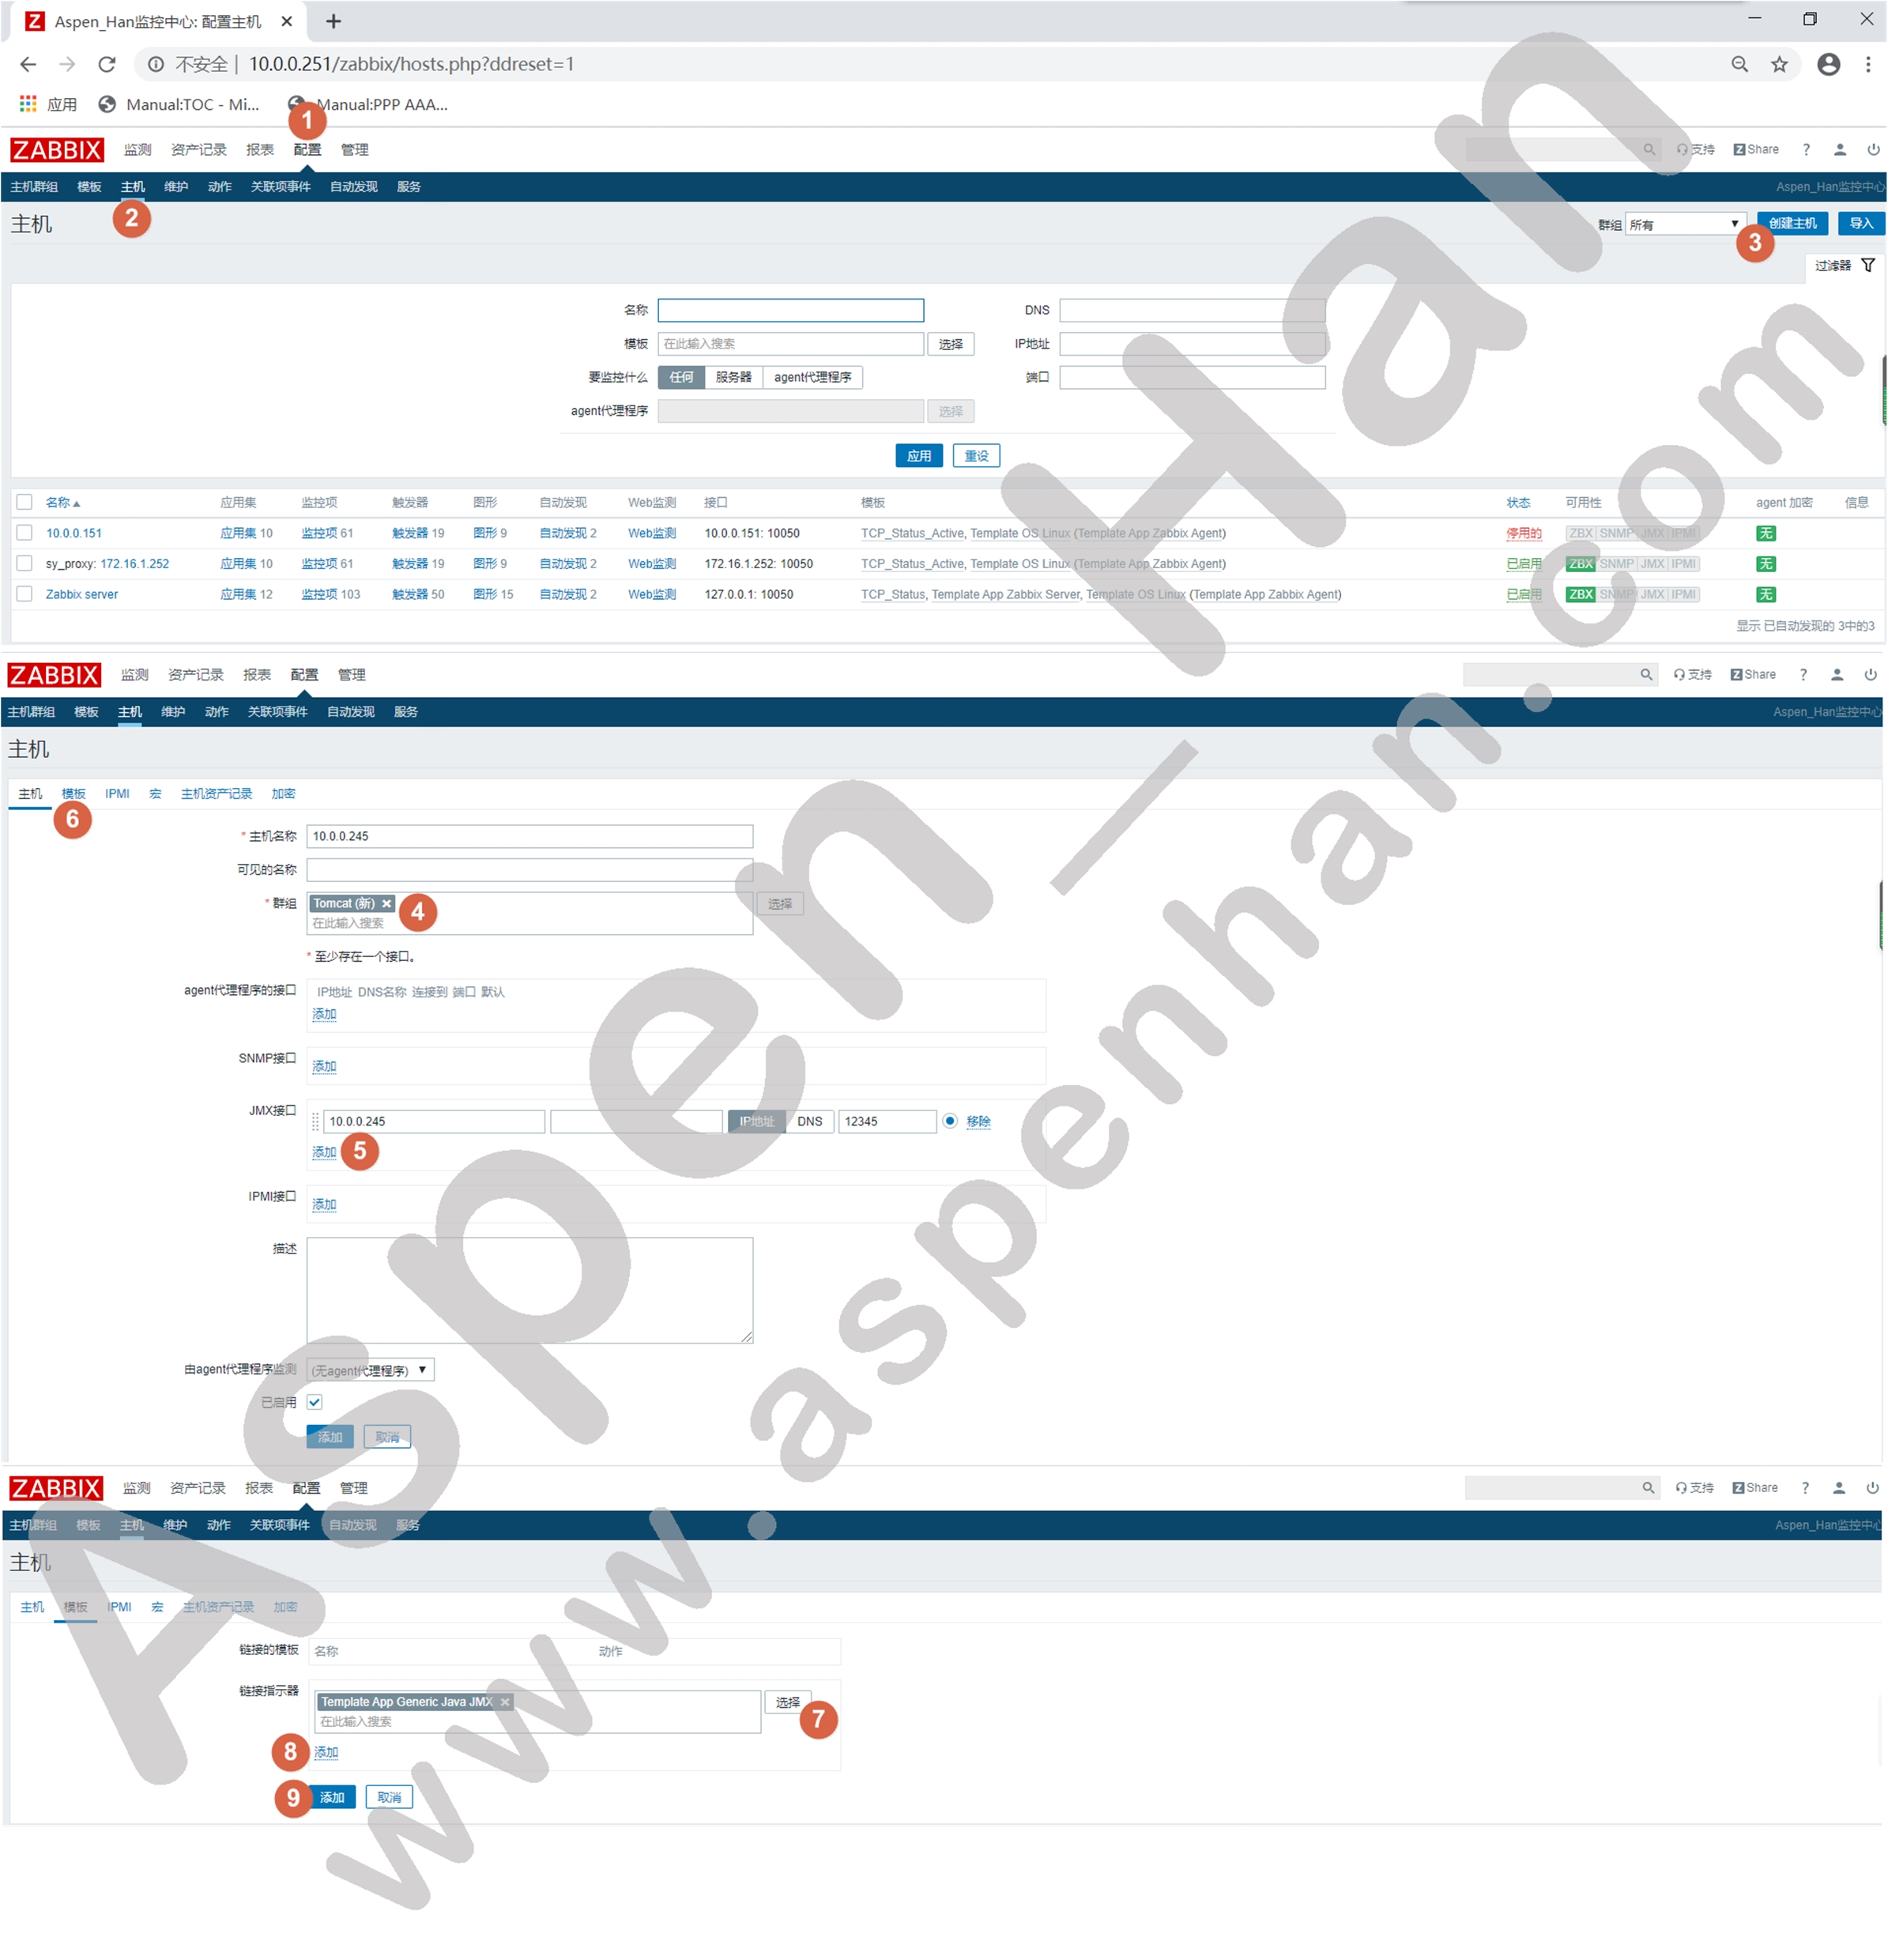
[root@zabbix-server ~]# systemctl restart zabbix-server.service step 8 Web端添加JVM主机
| 配置 -> 主机 -> 创建主机 |
七、Zabbix的高级特性
1. Zabbix自动发现
step 1 配置自动发现
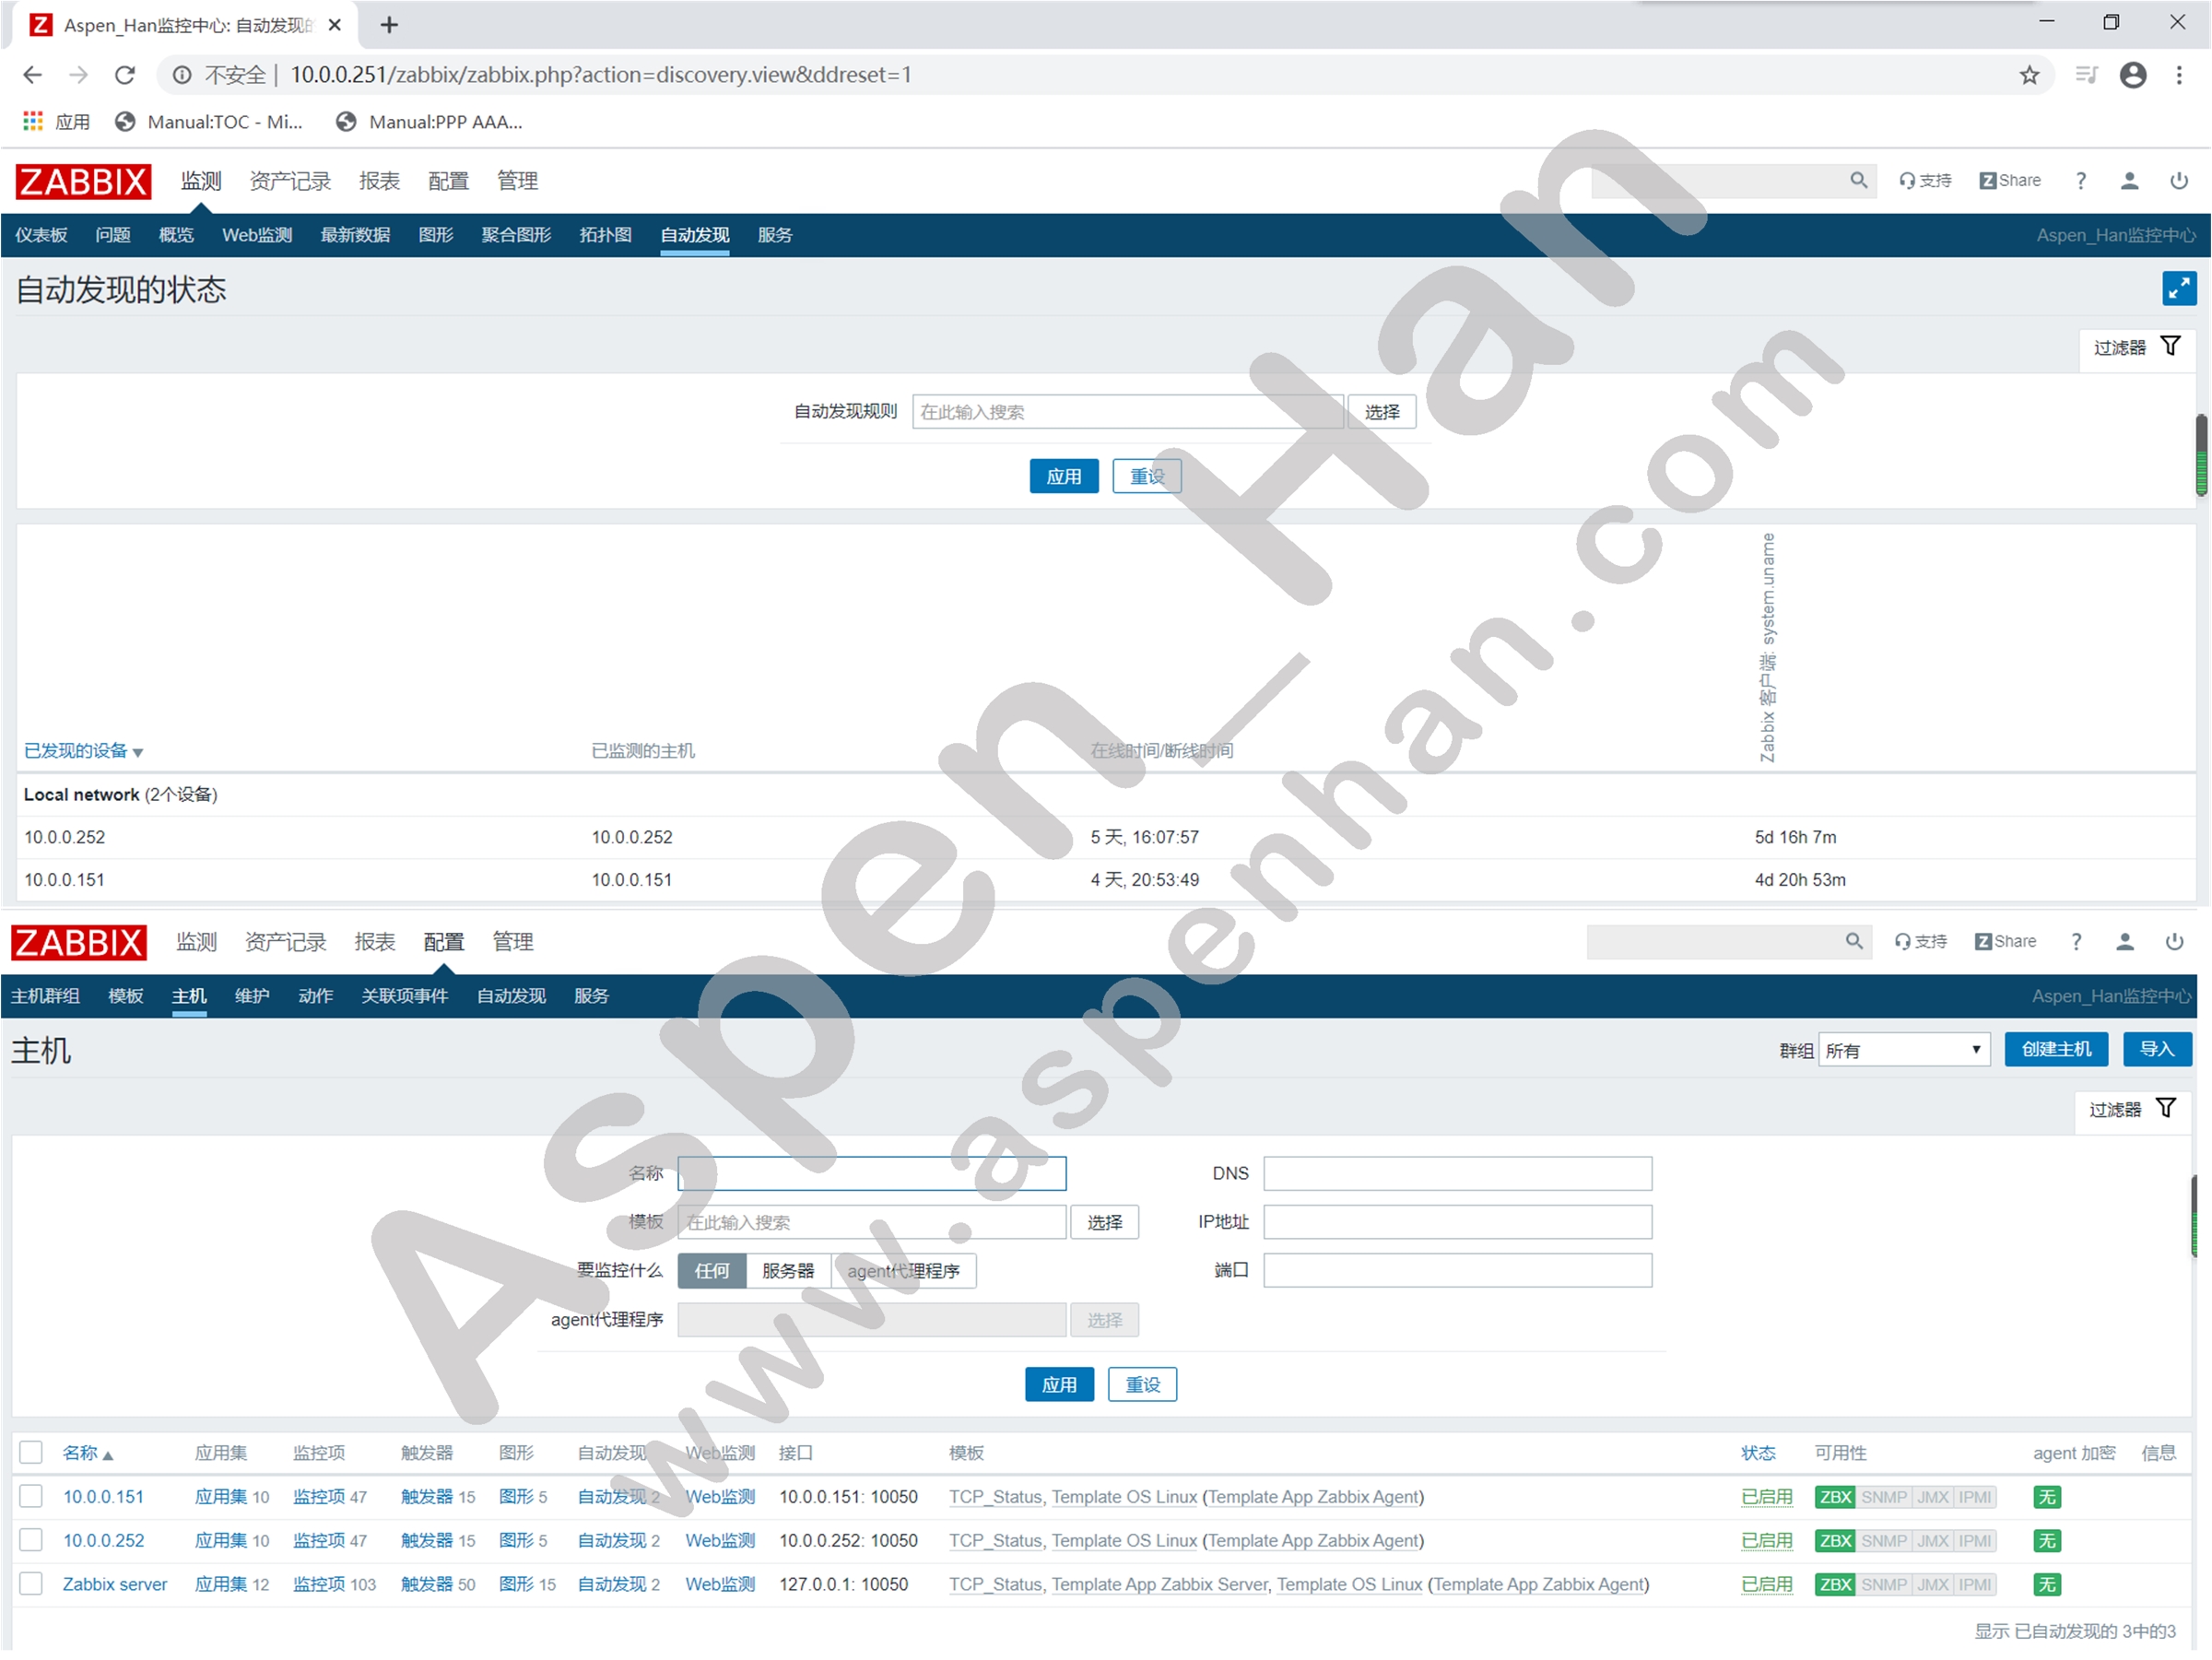
| 配置 -> 自动发现 -> 特定自动发现规则 |
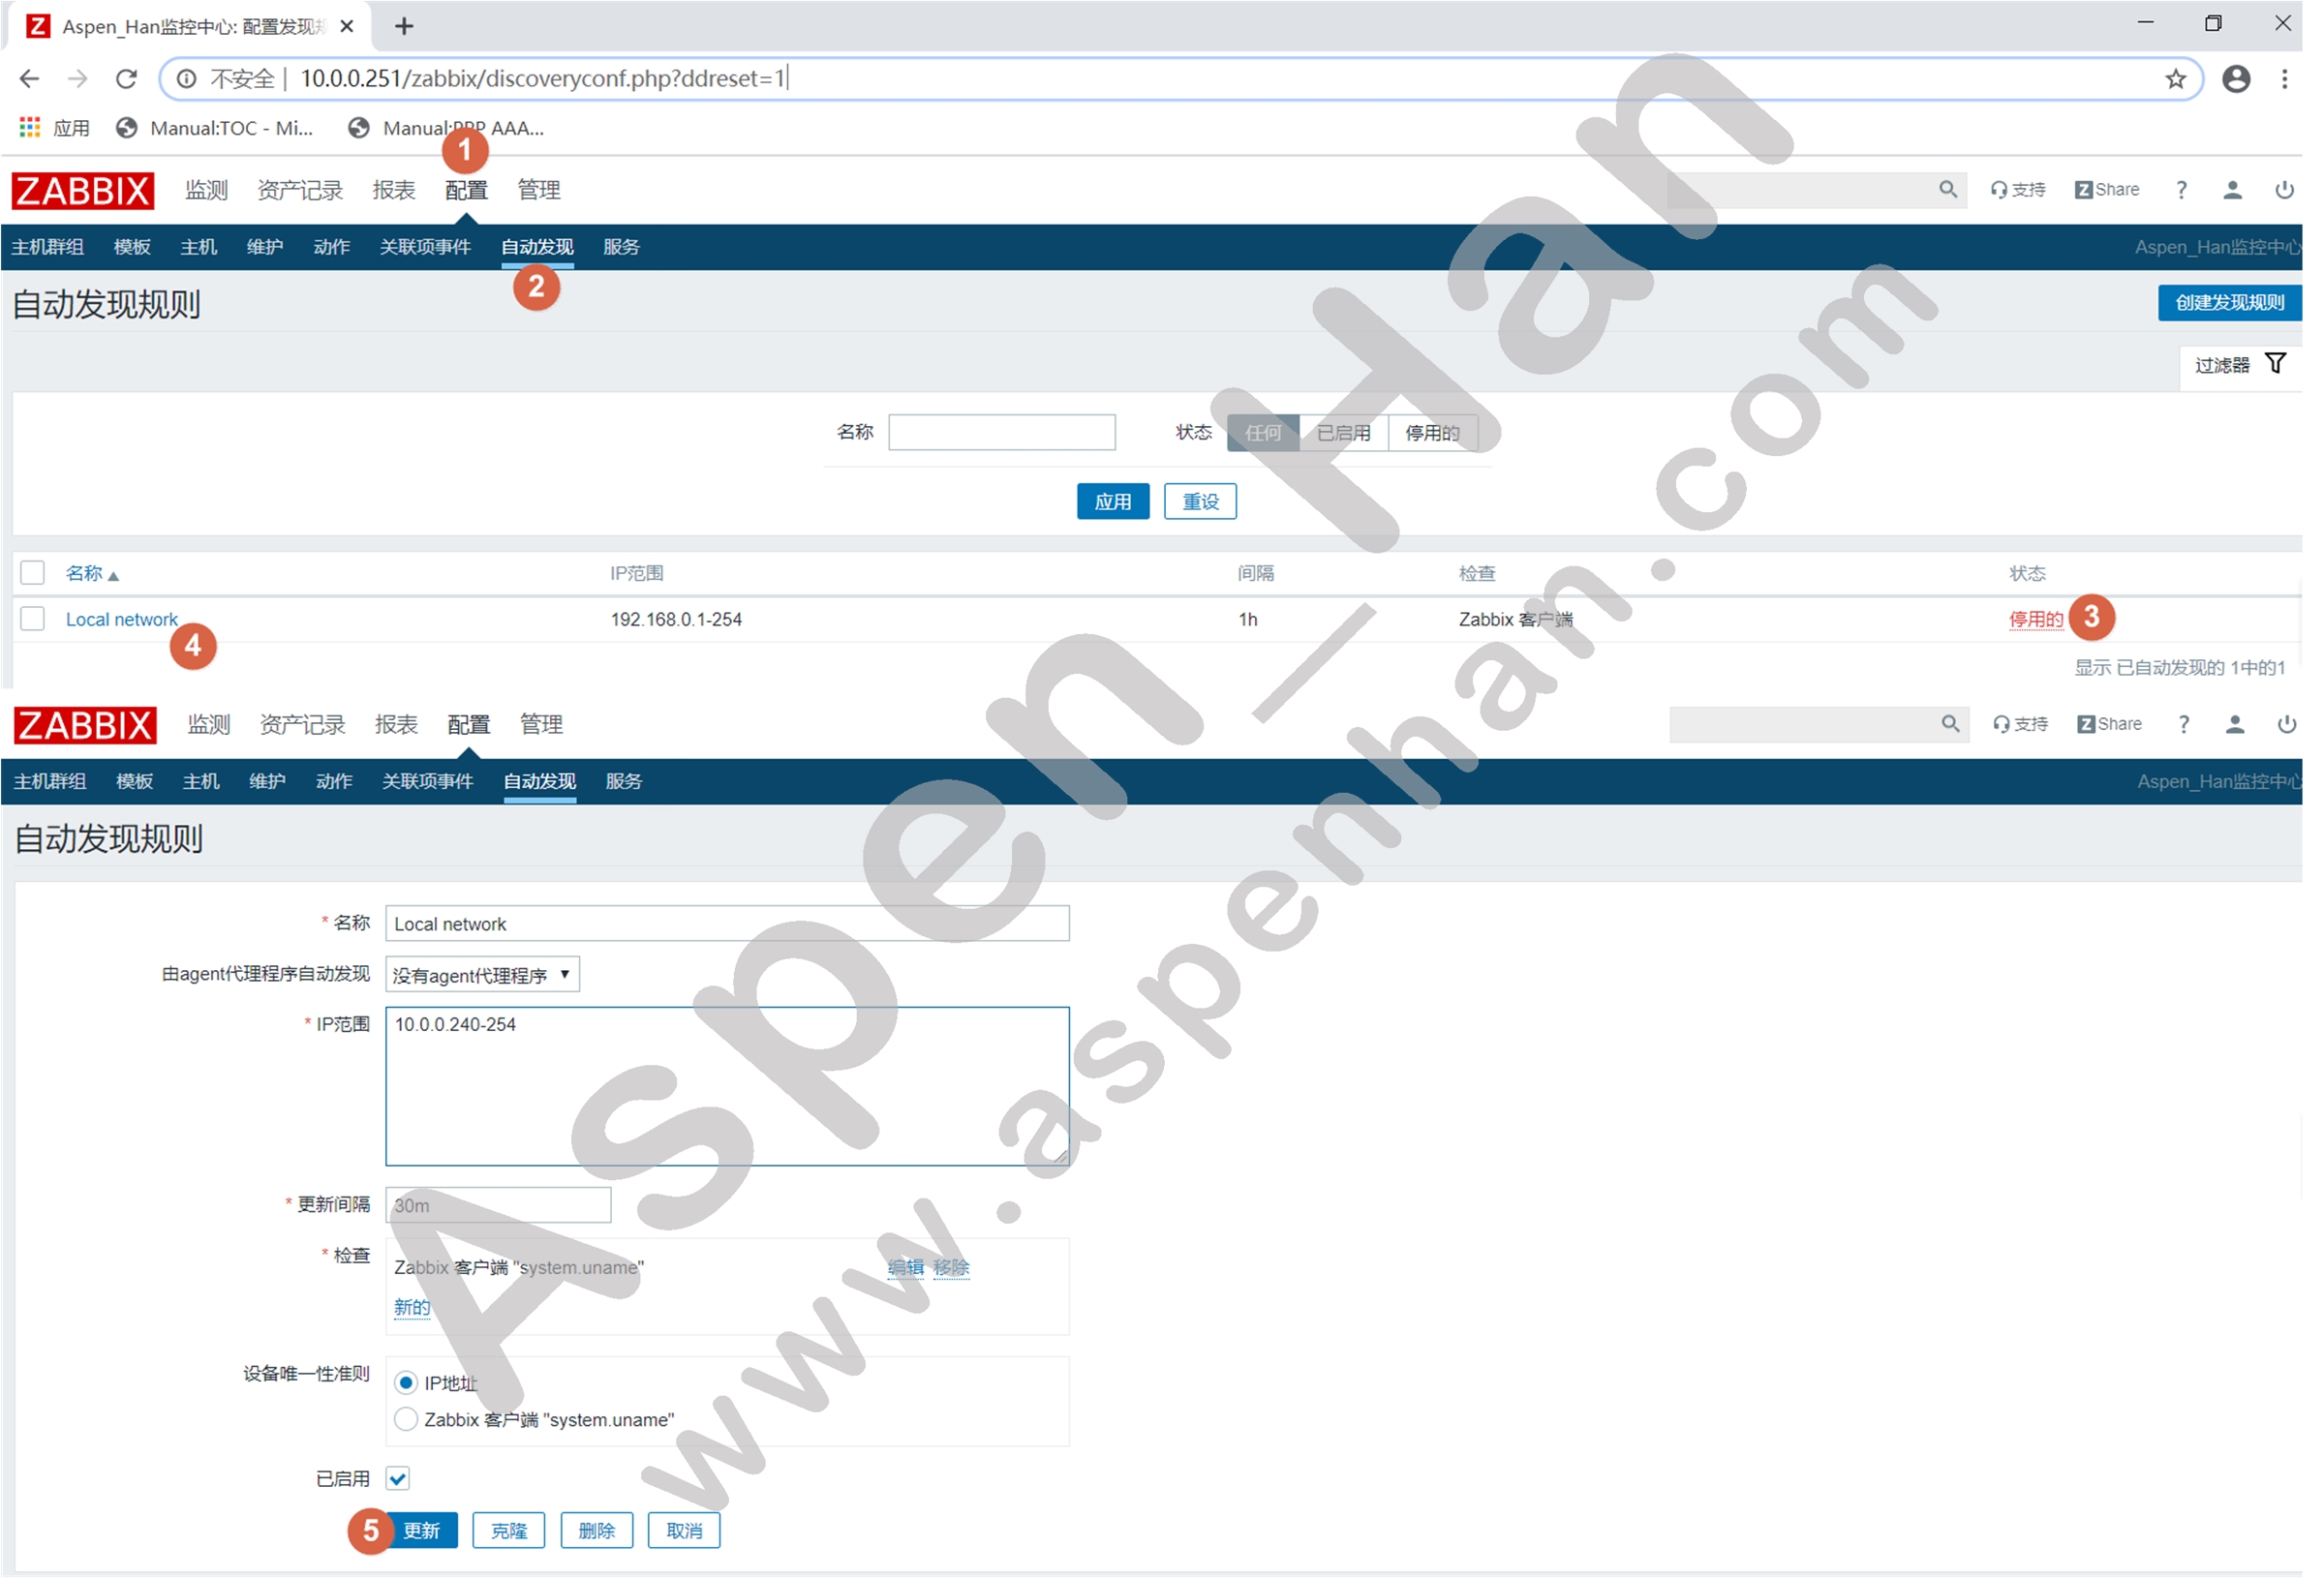
[root@zabbix-server ~]# zabbix_get -s 10.0.0.252 -k system.uname
Linux zabbix-web 3.10.0-957.el7.x86_64 #1 SMP Thu Nov 8 23:39:32 UTC 2018 x86_64
step 2 启用动作
| 配置 -> 动作 -> 自动发现 |
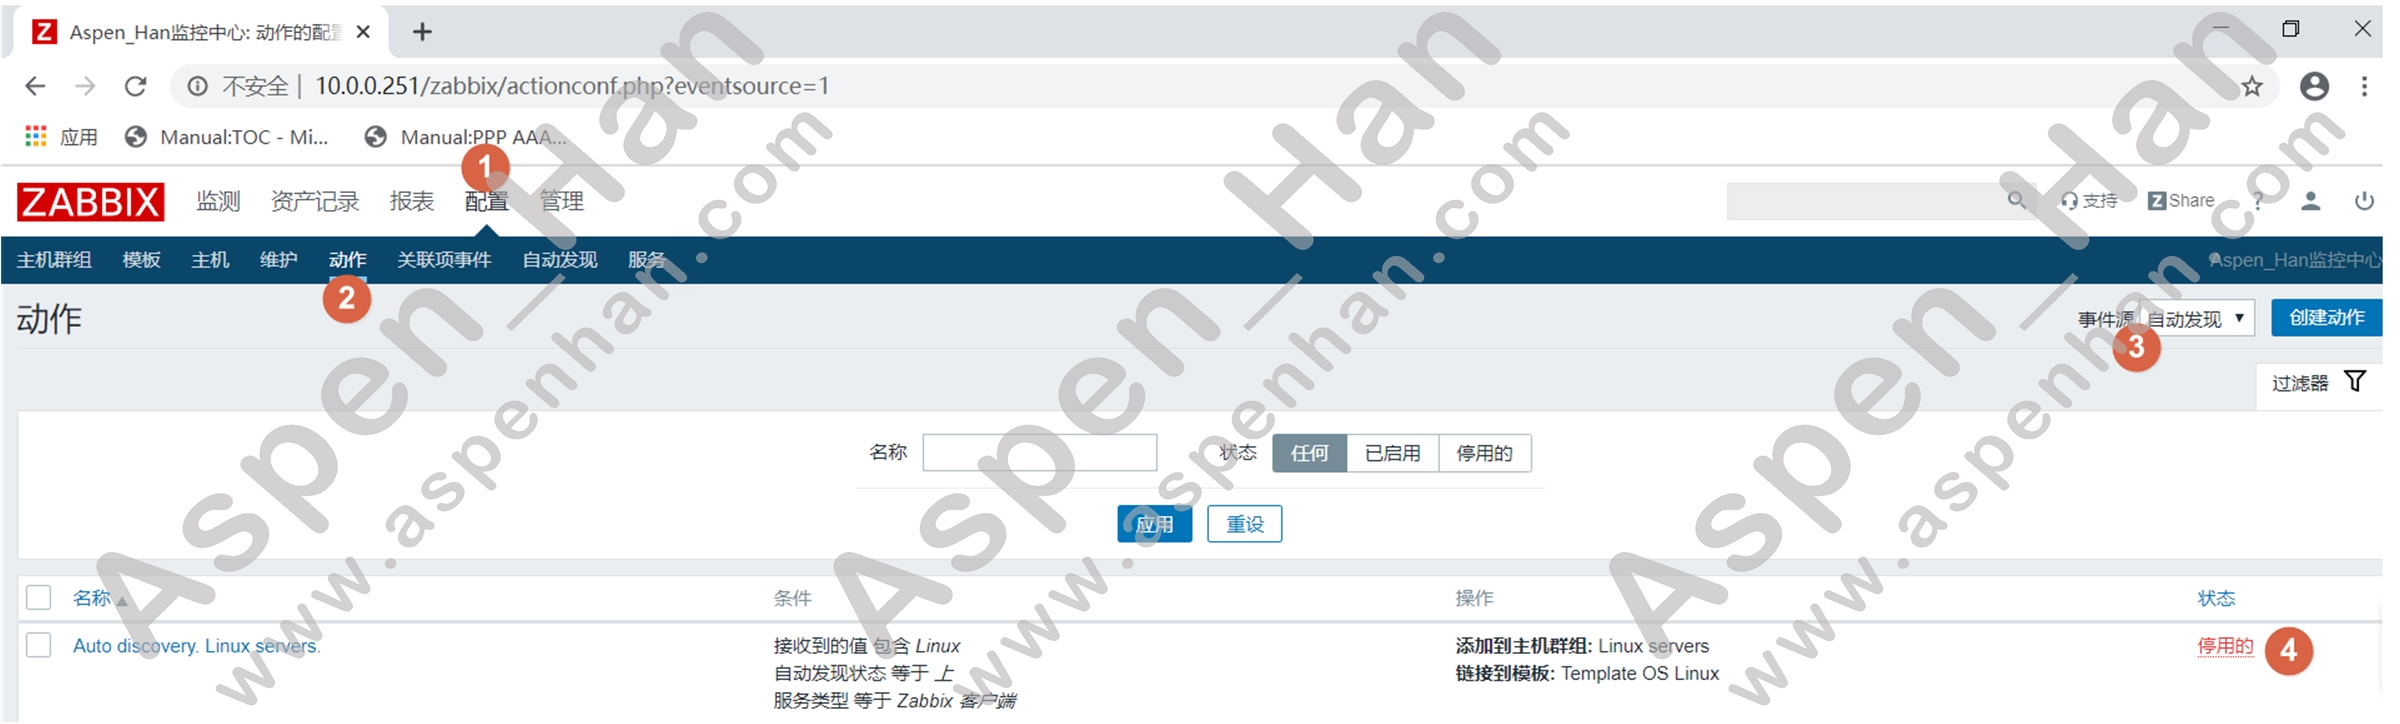
step 3 配置规则
| 配置 -> 动作 -> 自动发现 -> 特定规则 -> 操作 |

验证
| 若监测主机名称为localhost或者bogon,请修改server端的/etc/hosts文件; |
2.Zabbix自动注册
| Zabbix自动注册效率高于Zabbix自动发现 |
step 1 创建动作
| 配置 -> 动作 -> 自动注册 -> 创建动作 |
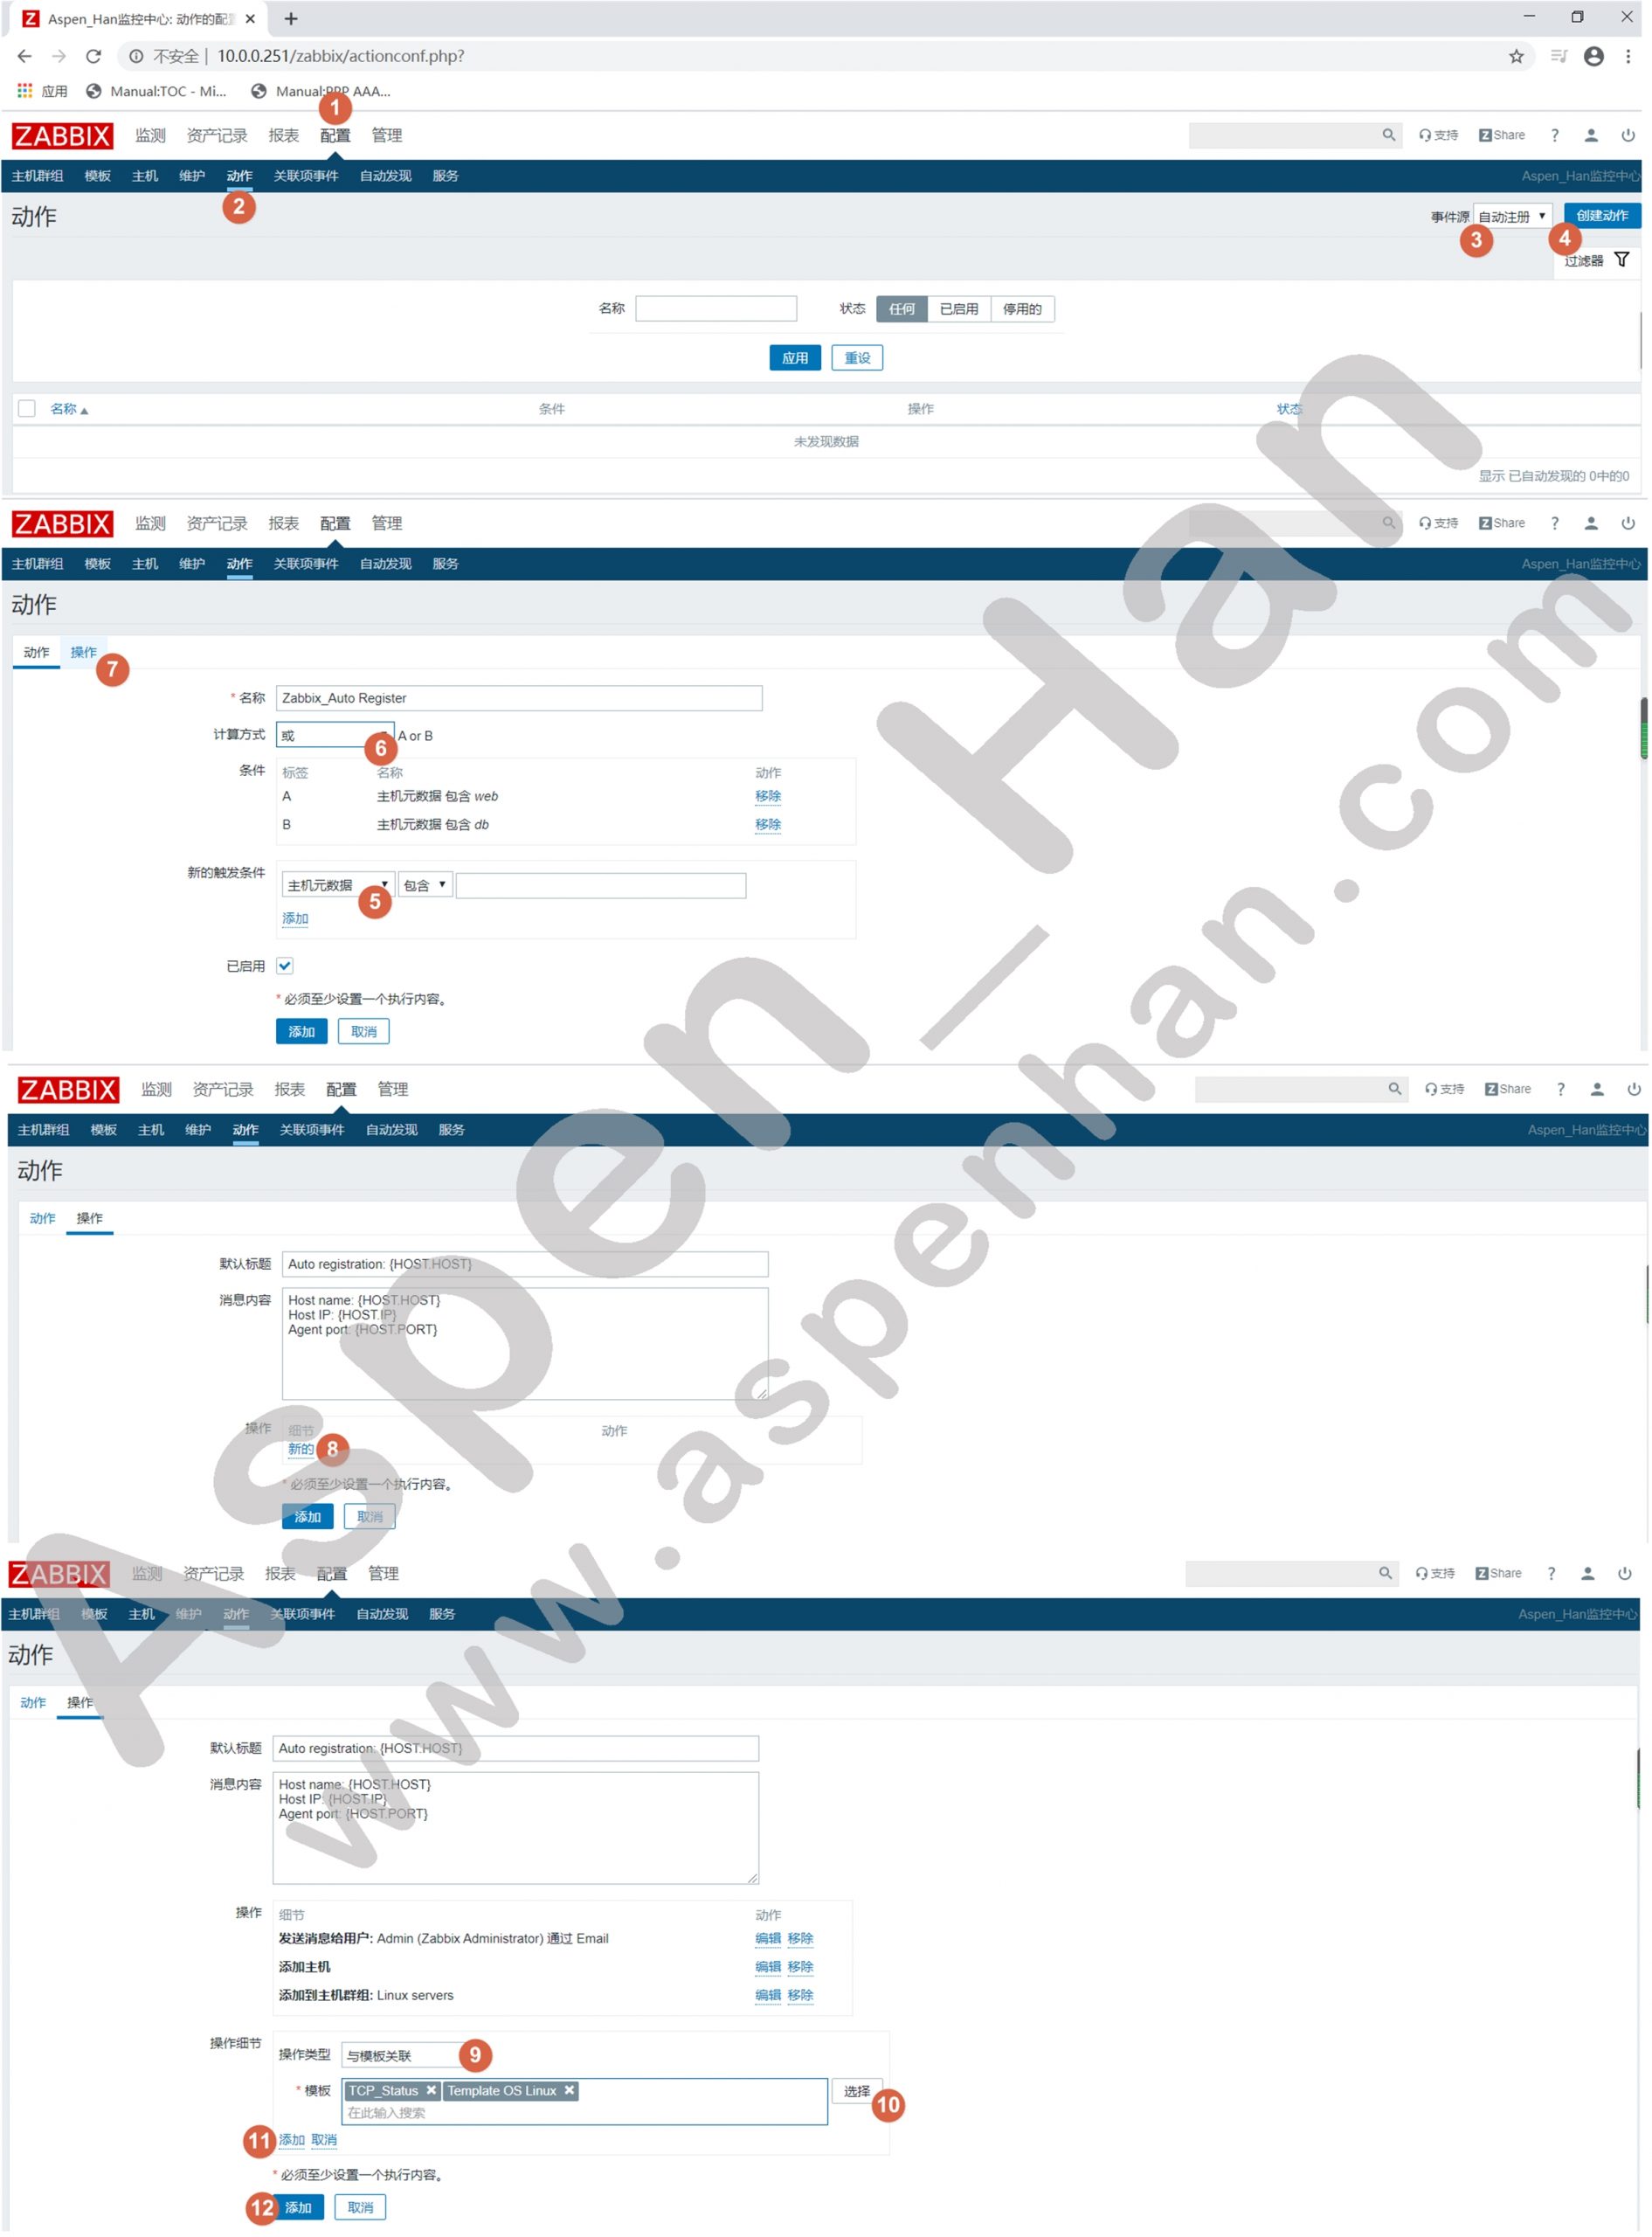
step 2 配置Agent
|
#/etc/zabbix/zabbix_agentd.conf
Server=IP地址 #指定Zabbix Server IP地址 |
[root@zabbix-web ~]# grep -E '^Host|^Server' /etc/zabbix/zabbix_agentd.conf
Server=10.0.0.251
ServerActive=10.0.0.251
Hostname=10.0.0.252
HostMetadata=web
[root@db01 ~]# grep -E '^(Host|Server)' /etc/zabbix/zabbix_agentd.conf
Server=10.0.0.251
ServerActive=10.0.0.251
Hostname=10.0.0.151
HostMetadata=dbstep 3 重启zabbix-agent服务
| systemctl restart zabbix-agent |
[root@zabbix-web ~]# systemctl restart zabbix-agent.service[root@db01 ~]# systemctl restart zabbix-agent.service 3. Zabbix低级自动发现
|
低级自动发现(LLD) 提供了一种在计算机上为不同实体自动创建监控项、触发器和图形的方法。 LLD特别适合于监控既有规律(监控指标相同)、又有差异(监控项名称不同)的监控对象。 |
step 1 创建自动发现规则脚本
本文以监控docker容器为例
|
#!/bin/bash port=($(/usr/bin/docker ps -a|grep -v "CONTAINER ID"|awk '{print $NF}')) printf '{\n' printf '\t"data":[\n' for key in ${!port[@]}
do
if [[ "${#port[@]}" -gt 1 && "${key}" -ne "$((${#port[@]}-1))" ]];then printf '\t {\n'
printf "\t\t\t\"{#CONTAINERNAME}\":\"${port[${key}]}\"},\n"
else [[ "${key}" -eq "((${#port[@]}-1))" ]]
printf '\t {\n'
printf "\t\t\t\"{#CONTAINERNAME}\":\"${port[${key}]}\"}\n"
fi
done
printf '\t ]\n'
printf '}\n'
|
#!/bin/bash
Container_ID=($(/usr/bin/docker ps -a| awk 'NR>1 {print $1}'))
printf '{\n'
printf '\t "data":[\n'
for key in ${!Container_ID[@]}
do
    if [[ "${#Container_ID[@]}" -gt 1 && "${key}" -ne "$((${#Container_ID[@]}-1))" ]];then
        printf "\t\t{\"{#CONTAINER_ID}\":\"${Container_ID[${key}]}\"},\n"
    else
        printf "\t\t{\"{#CONTAINER_ID}\":\"${Container_ID[${key}]}\"}\n"
    fi
done
printf '\t ]\n'
printf '}\n'
[root@k8s-node01 ~]# mkdir -p /server/scripts/
[root@k8s-node01 ~]# vim /server/scripts/docker_discover.sh
[root@k8s-node01 ~]# sh /server/scripts/docker_discover.sh
{
"data":[
{"{#CONTAINER_ID}":"afc2046c653c"},
{"{#CONTAINER_ID}":"3850787621ad"},
{"{#CONTAINER_ID}":"b6bf83e011f4"},
{"{#CONTAINER_ID}":"b2d1c51e12c7"},
{"{#CONTAINER_ID}":"c48505f42996"},
{"{#CONTAINER_ID}":"133eb8dc3379"}
]
}
#为相关命令配置相应权限
[root@k8s-node01 ~]# chmod o+rw /var/run/docker.sock
[root@k8s-node01 ~]# ll /var/run/docker.sock
srw-rw-rw- 1 root root 0 Sep 27 16:57 /var/run/docker.sock|
Docker-CE环境中,可以使用 chmod u+s /usr/bin/docker帮助zabbix用户获得docker命令的执行权限; 但是在K8S环境中,请使用chmod o+rw /var/run/docker.sock指令 |
step 2 定义自动发现规则配置文件
| 自动发现规则是一种特殊的监控项。 |
[root@zabbix-proxy ~]# zabbix_get -s 172.16.1.252 -k net.if.discovery
{"data":[{"{#IFNAME}":"eth0"},{"{#IFNAME}":"eth1"},{"{#IFNAME}":"lo"}]}|
#include=/etc/zabbix/zabbix_agentd.d/*.conf UserParameter=键名[*],取值脚本 变量 |
[root@k8s-node01 ~]# tail -1  /etc/zabbix/zabbix_agentd.d/zbx_docker_low_level_discover.conf
UserParameter=LLD.Docker.Container_ID,/bin/bash /server/scripts/docker_discover.sh
step 3 重启Zabbix-Agent
| systemctl restart zabbix-agent |
[root@k8s-node01 ~]# systemctl restart zabbix-agent.servicestep 4 手动测试监控项
| zabbix_get -s IP地址 -k 监控项 |
[root@zabbix-server ~]# zabbix_get -s 10.0.0.120 -k LLD.Docker.Container_ID
{
"data":[
{"{#CONTAINER_ID}":"afc2046c653c"},
{"{#CONTAINER_ID}":"3850787621ad"},
{"{#CONTAINER_ID}":"b6bf83e011f4"},
{"{#CONTAINER_ID}":"b2d1c51e12c7"},
{"{#CONTAINER_ID}":"c48505f42996"},
{"{#CONTAINER_ID}":"133eb8dc3379"}
]
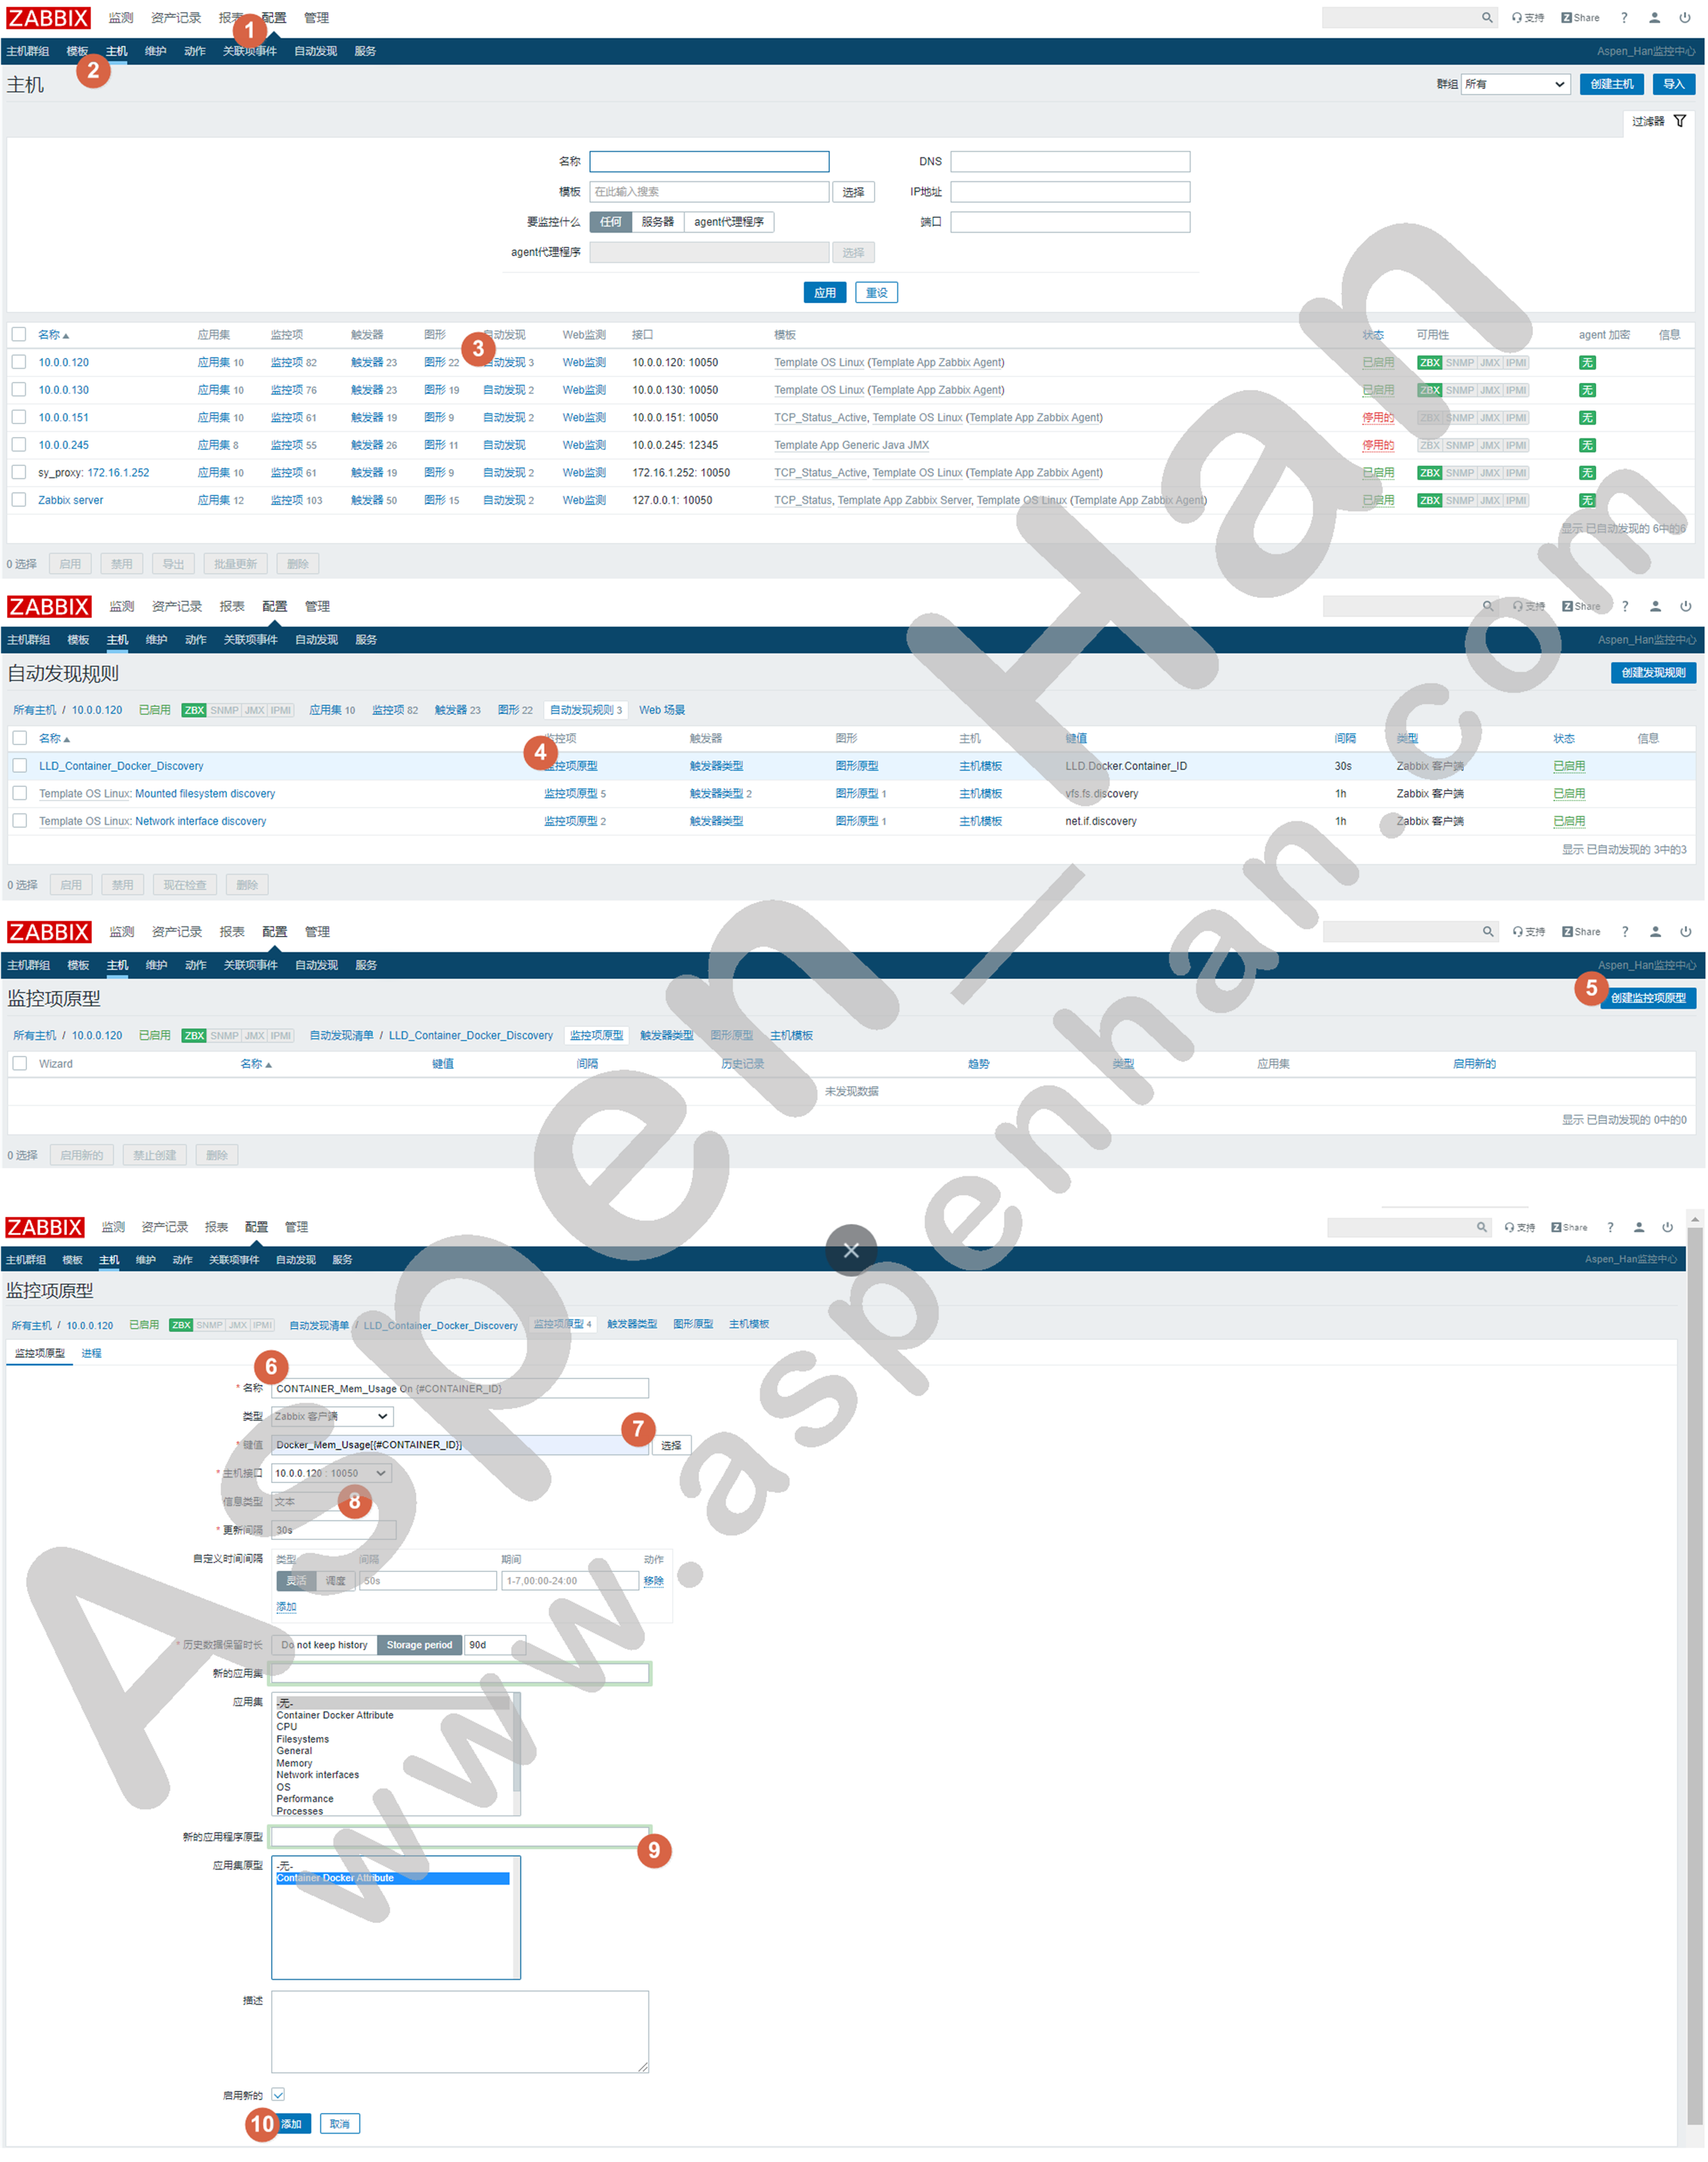
}step 5 Web端创建自动发现规则
| 配置 -> 主机 -> 特定主机 -> 自动发现 -> 创建发现规则 |
| 本文是为了测试监控效果所以直接在主机上创建发现规则,在实际生产环境中,通常将自动发现规则和监控项原型创建在模版中; |
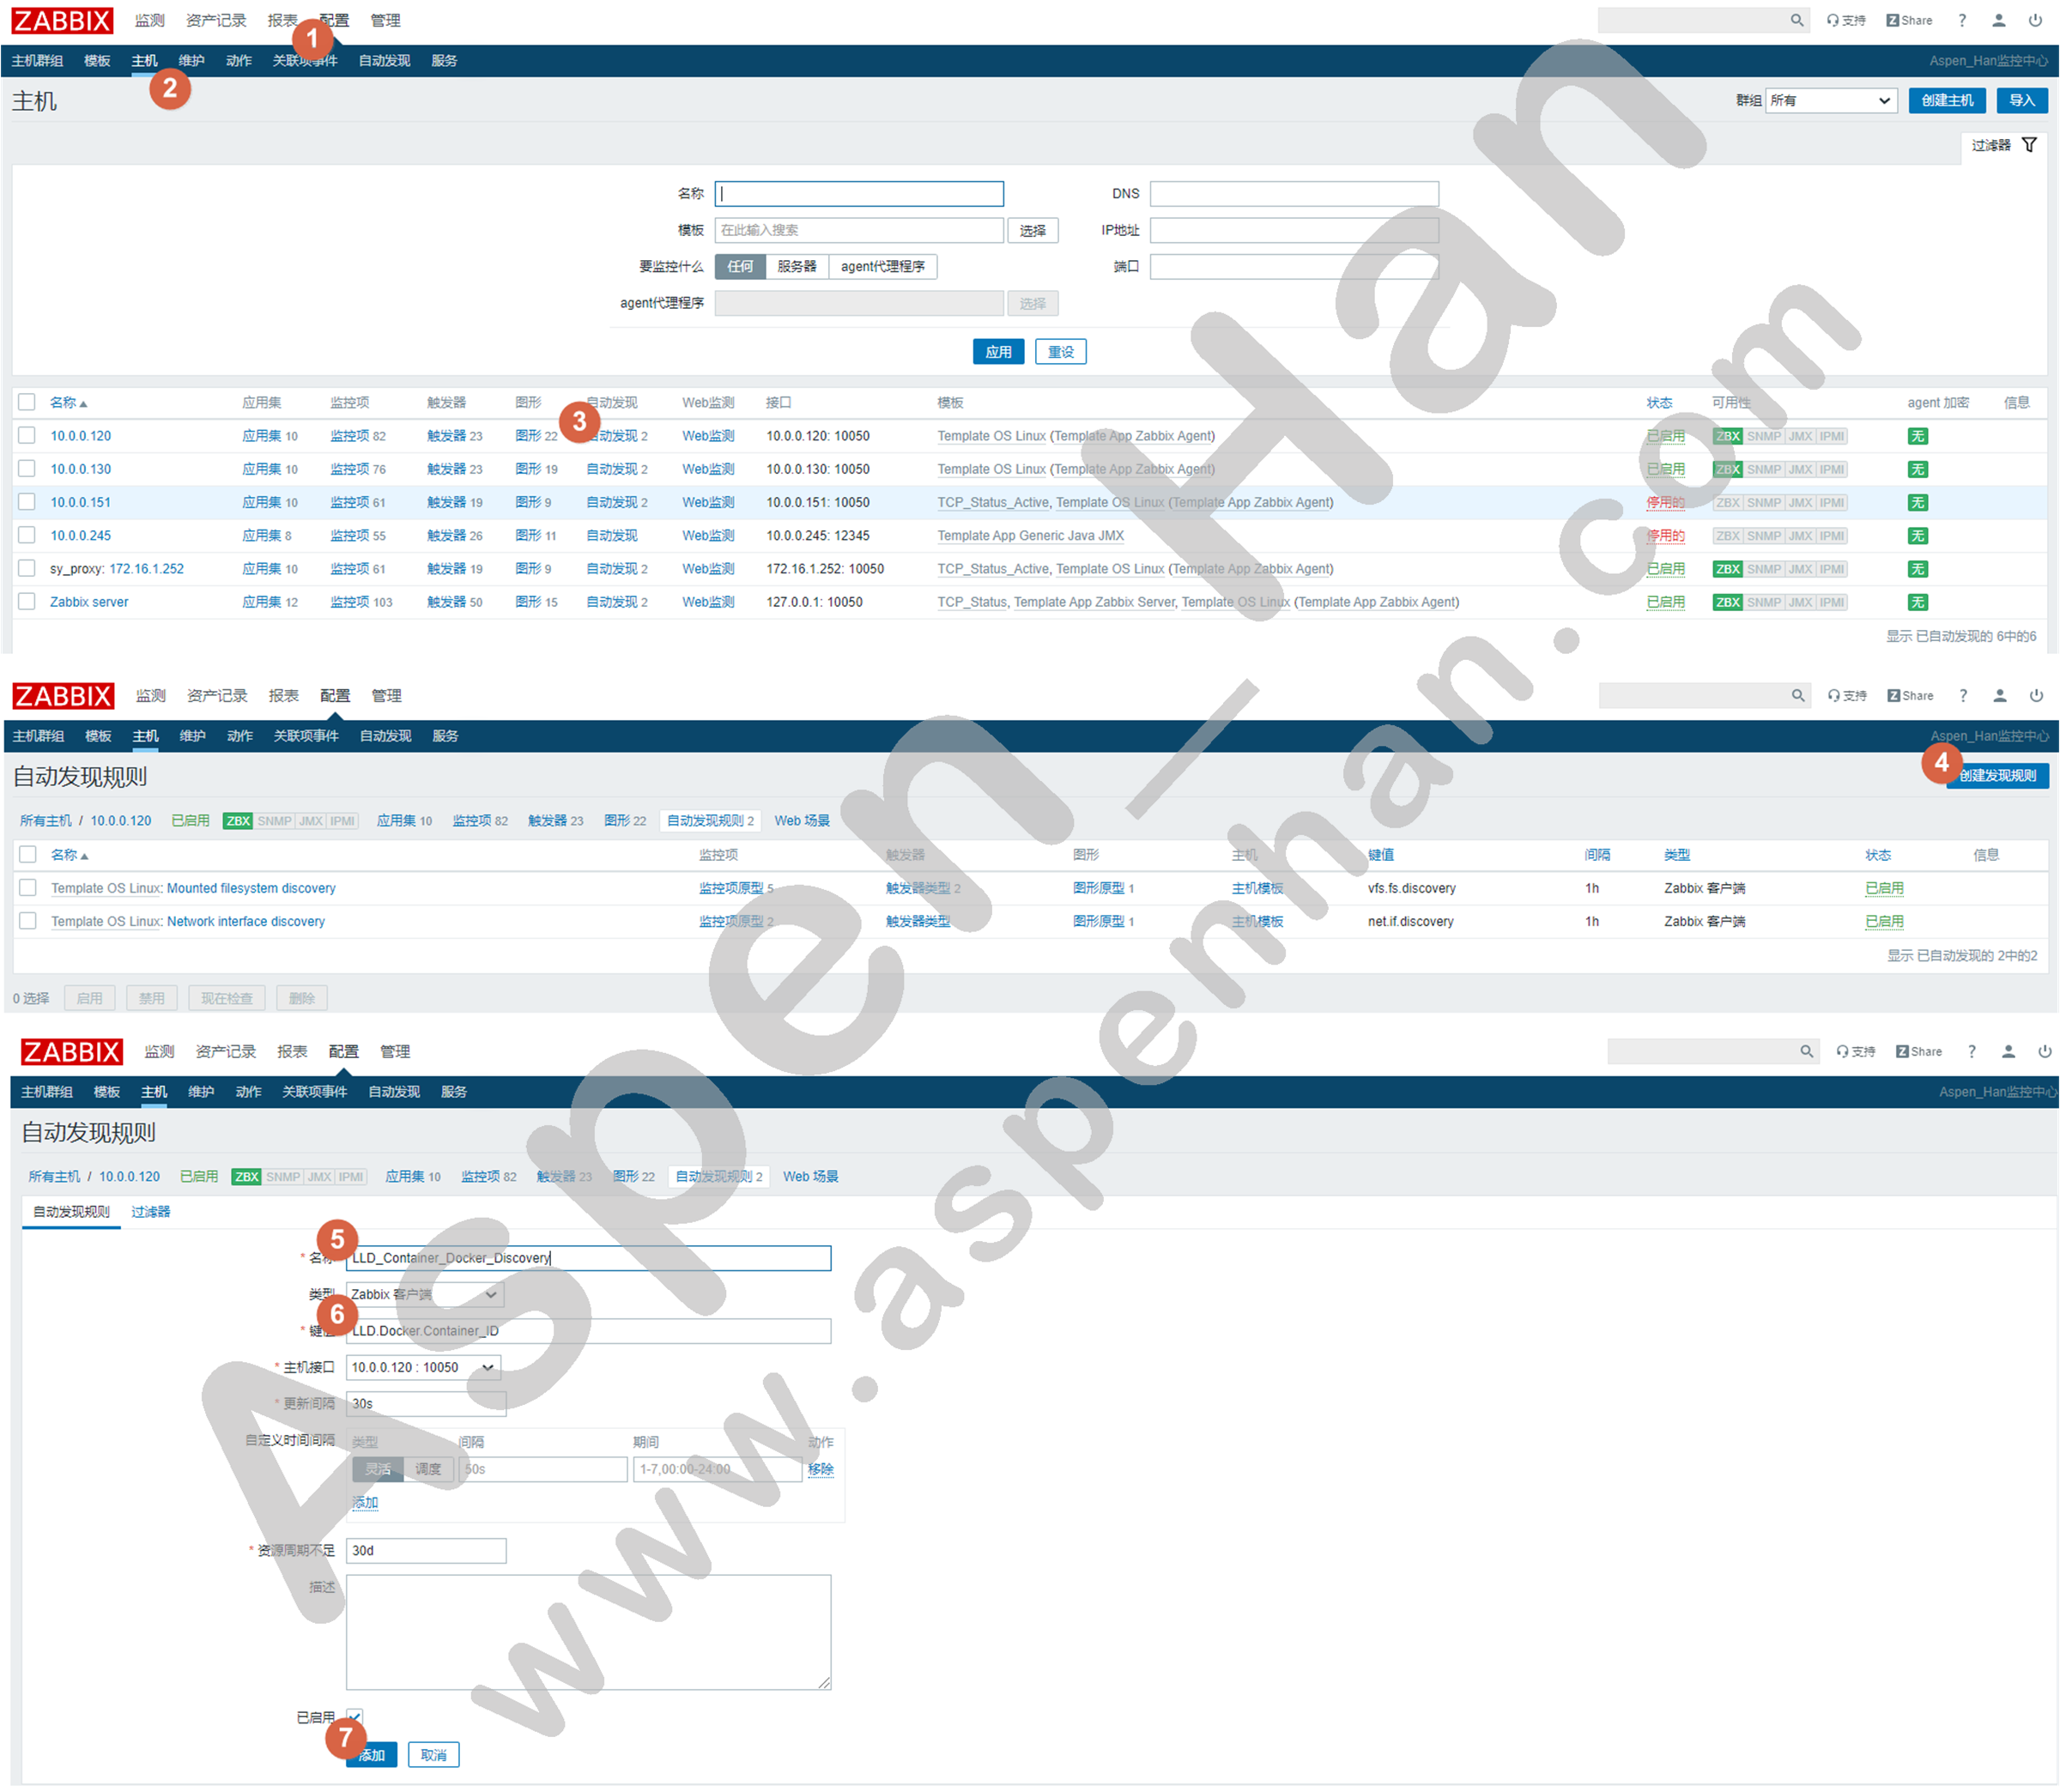
step 6 命令行或脚本取得监控值
| docker stats --no-stream | awk '/容器名/ {print $8}' | tr -d '%' |
[root@k8s-node01 ~]# docker stats --no-stream
CONTAINER           CPU %               MEM USAGE / LIMIT       MEM %               NET I/O
afc2046c653c        0.00%               1.348 MiB / 2.919 GiB   0.05%               2.27 kB / 656 B
3850787621ad        0.00%               1.336 MiB / 2.919 GiB   0.04%               2.44 kB / 656 B
b6bf83e011f4        0.00%               1.344 MiB / 2.919 GiB   0.04%               2.53 kB / 656 B
b2d1c51e12c7        0.00%               268 KiB / 2.919 GiB     0.01%               2.44 kB / 656 B
c48505f42996        0.00%               264 KiB / 2.919 GiB     0.01%               2.27 kB / 656 B
133eb8dc3379        0.00%               268 KiB / 2.919 GiB     0.01%               2.53 kB / 656 B
[root@k8s-node01 ~]# docker stats --no-stream | grep afc2046c653c | awk '{print $8}' | tr -d '%'
0.05
step 7 定义监控项
|
#include=/etc/zabbix/zabbix_agentd.d/*.conf UserParameter=键名[*],取值脚本 变量 |
|
注: 在自定义监控项中如果使用传参形式,即UserParameter=键名[*],取值命令的类型时,若取值命令含有$参数,如awk中的{print $7}需要在原本的$2参数前增加一个$符,变为{print $$7};若仍写为$2会被Zabbix当作取值需要传递的第2个参数; |
[root@k8s-node01 ~]# cat /etc/zabbix/zabbix_agentd.d/zbx_docker_low_level_discover.conf
UserParameter=LLD.Docker.Container_ID,/bin/bash /server/scripts/docker_discover.sh
UserParameter=Docker_Mem_Usage_Per[*],/usr/bin/docker stats --no-stream | grep $1 | awk '{print $$8}' |
UserParameter=Docker_Mem_Usage[*],/usr/bin/docker stats --no-stream | grep $1 | awk '{print $$3 $$4}'
UserParameter=Docker_CPU_Usage_Per[*],/usr/bin/docker stats --no-stream | grep $1 | awk '{print $$2}' |
UserParameter=Docker_Net_Recv[*],/usr/bin/docker stats --no-stream | grep $1 | awk '{print $$9 $$10}'
UserParameter=Docker_Net_Sent[*],/usr/bin/docker stats --no-stream | grep $1 | awk '{print $$12 $$13}
step 8 重启zabbix-agent
| systemctl restart zabbix-agent |
[root@k8s-node01 ~]# systemctl restart zabbix-agent.service step 9 手动测试监控项
| zabbix_get -s IP地址 -k 监控项 |
[root@zabbix-server ~]# zabbix_get -s 10.0.0.130 -k Docker_Mem_Usage_Per[bd2870f26875]
0.04
[root@zabbix-server ~]# zabbix_get -s 10.0.0.130 -k Docker_Mem_Usage[bd2870f26875]
1.344MiB
[root@zabbix-server ~]# zabbix_get -s 10.0.0.130 -k Docker_CPU_Usage_Per[bd2870f26875]
0.00
[root@zabbix-server ~]# zabbix_get -s 10.0.0.130 -k Docker_Net_Recv[bd2870f26875]
2.35kB
[root@zabbix-server ~]# zabbix_get -s 10.0.0.130 -k Docker_Net_Sent[bd2870f26875]
656B
step 10 创建监控项原型
| 配置 -> 主机 -> 特定主机 -> 自动发现 -> 监控项原型 -> 创建监控项原型 |
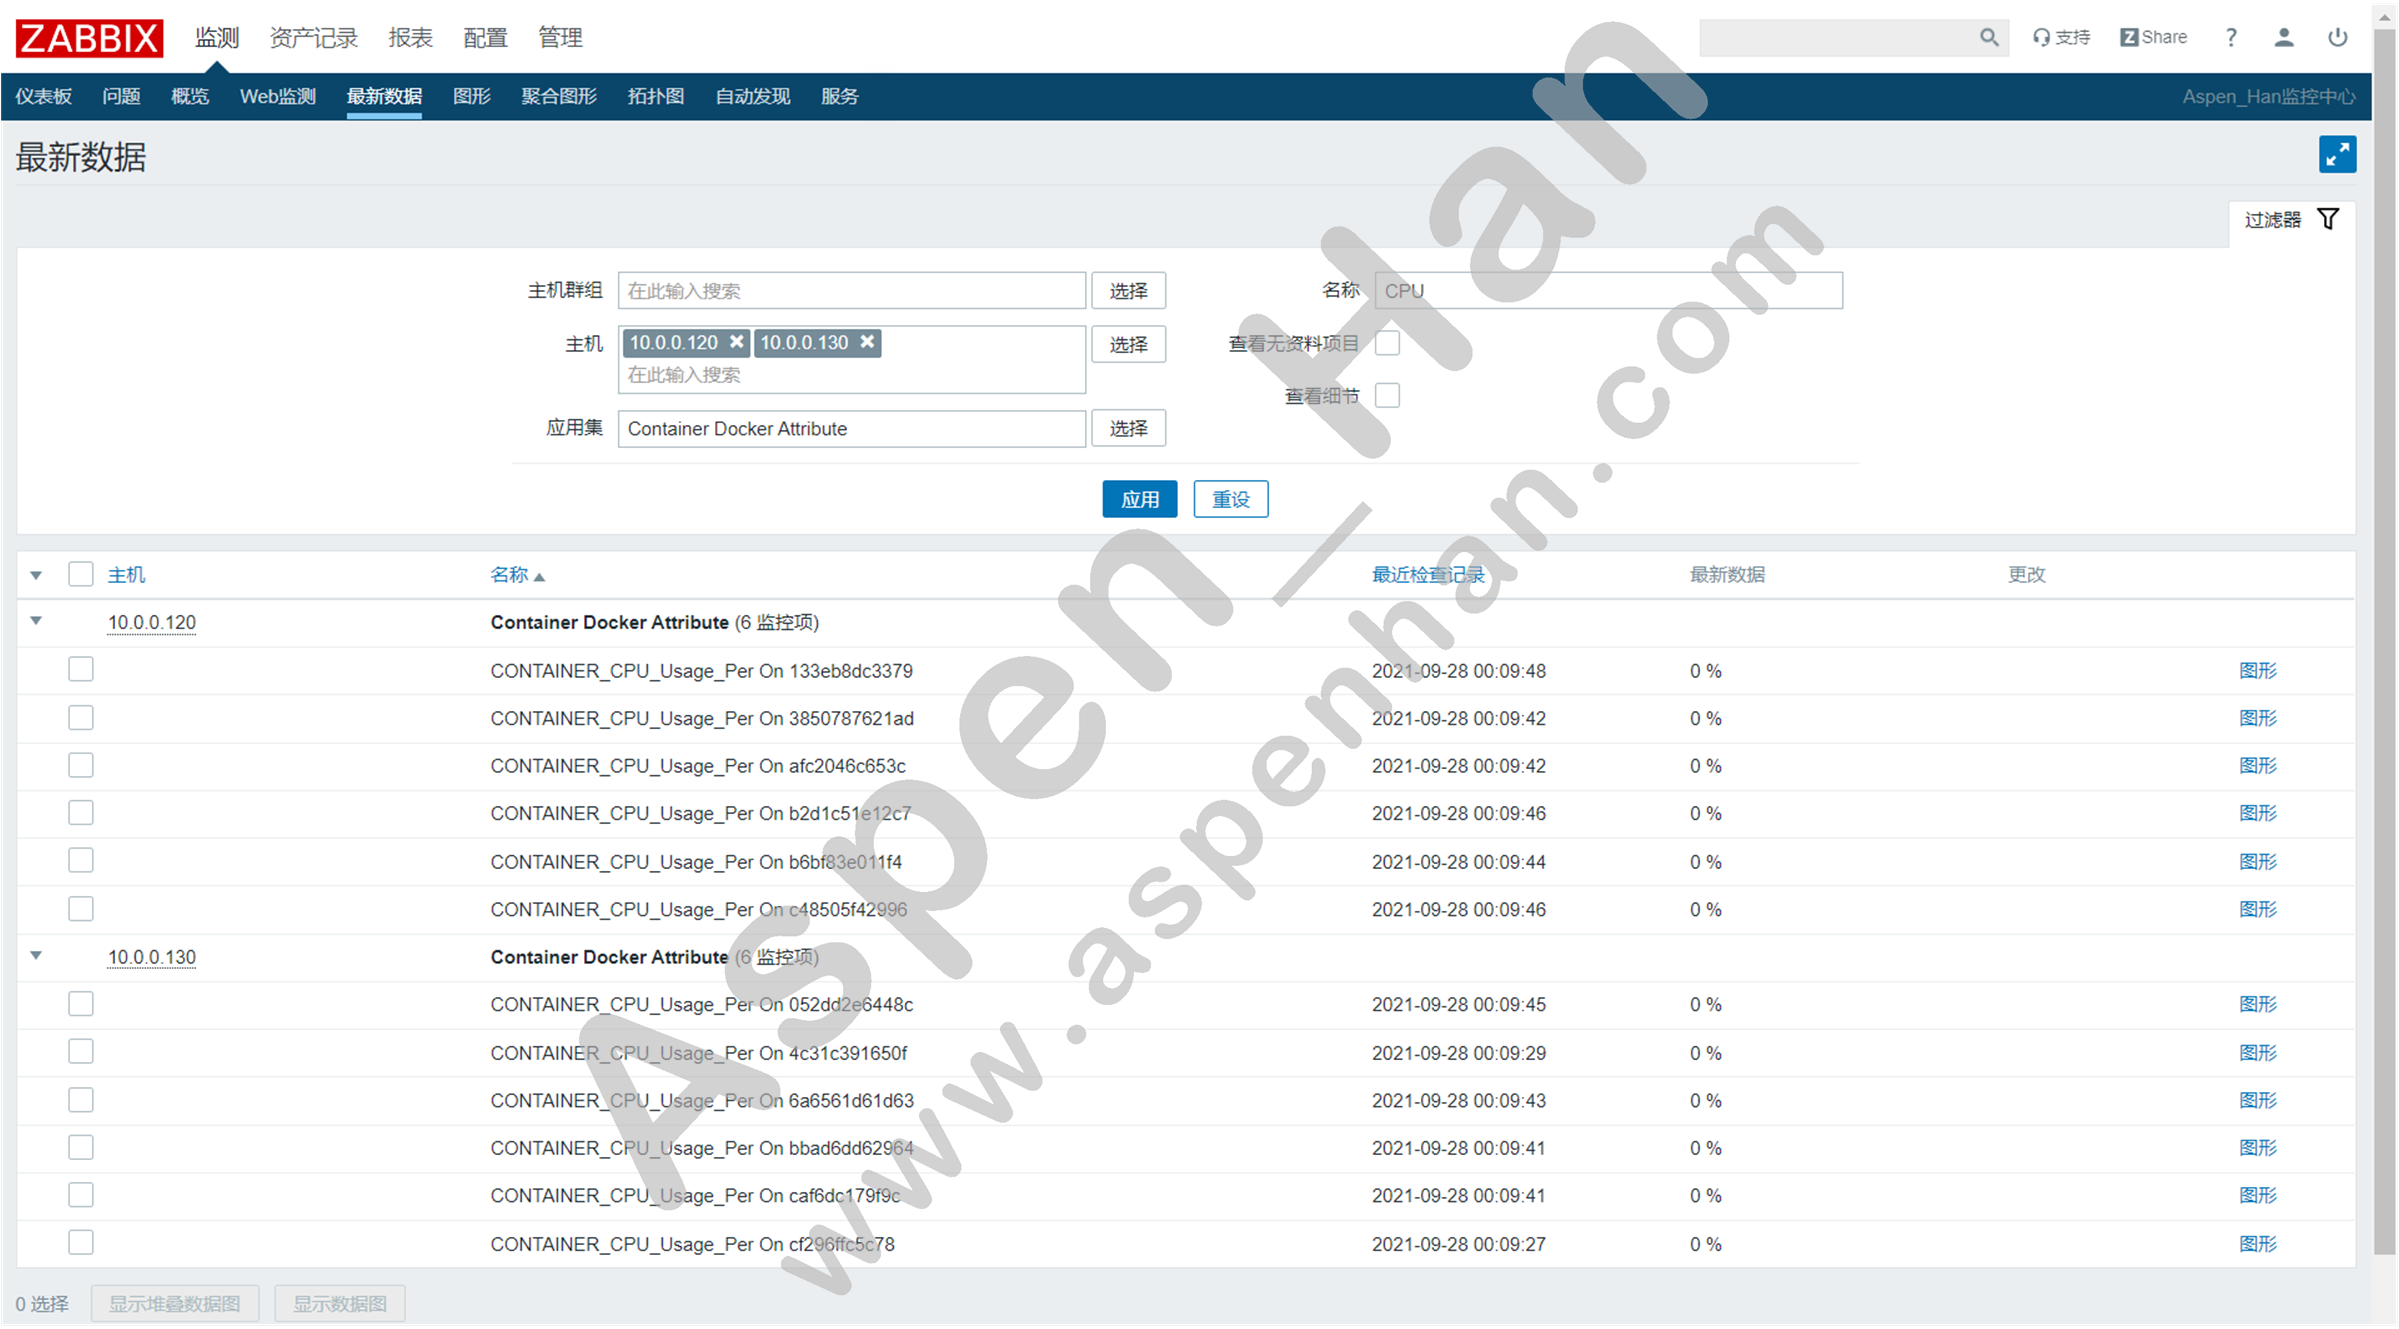
step 11 验证
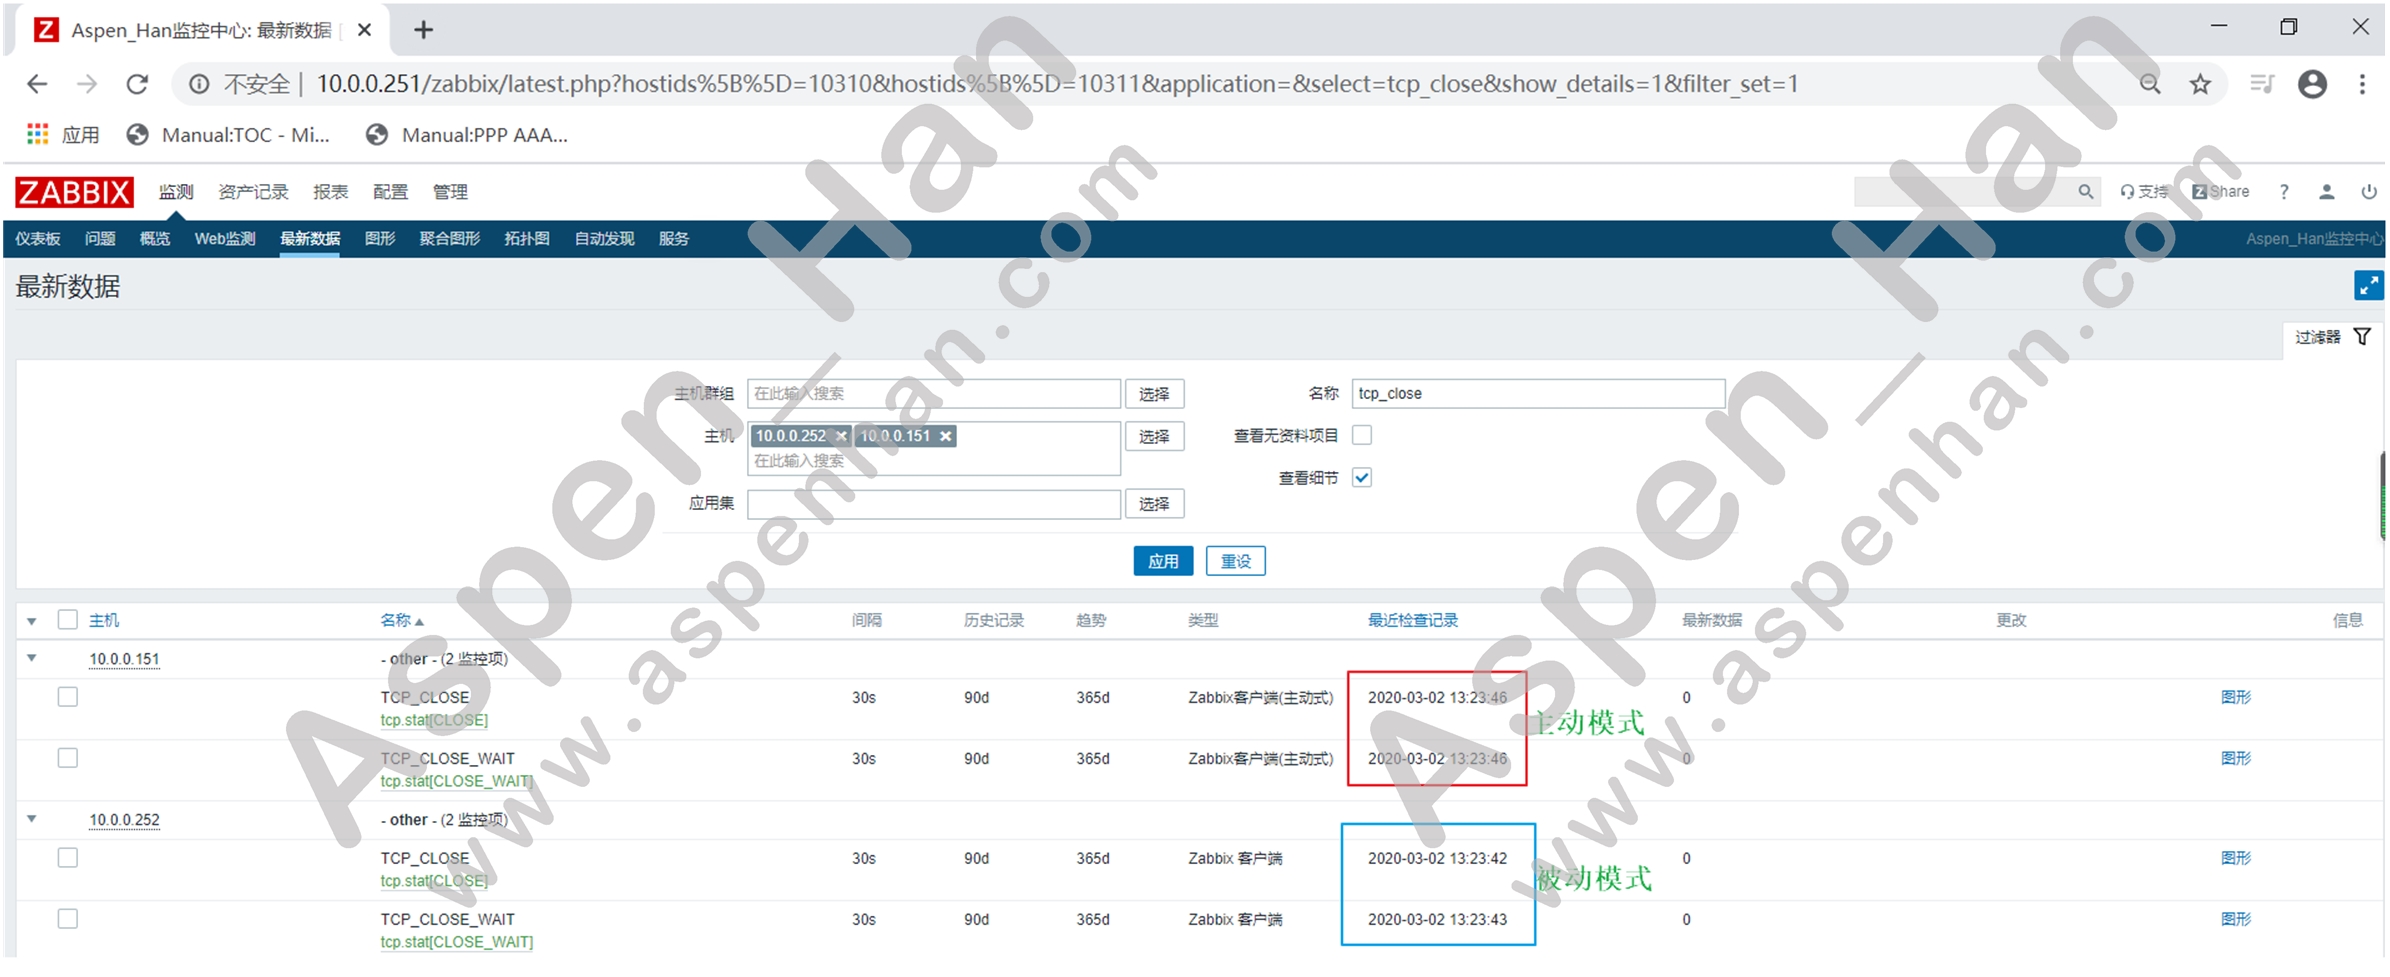
4. zabbix-agent主动模式
| Zabbix-agent默认工作在被动模式,但其主动模式的效率与性能高于被动模式 |
step 1 克隆被动模式模版
| 配置 -> 模版 -> 特定模版 -> 全克隆 |
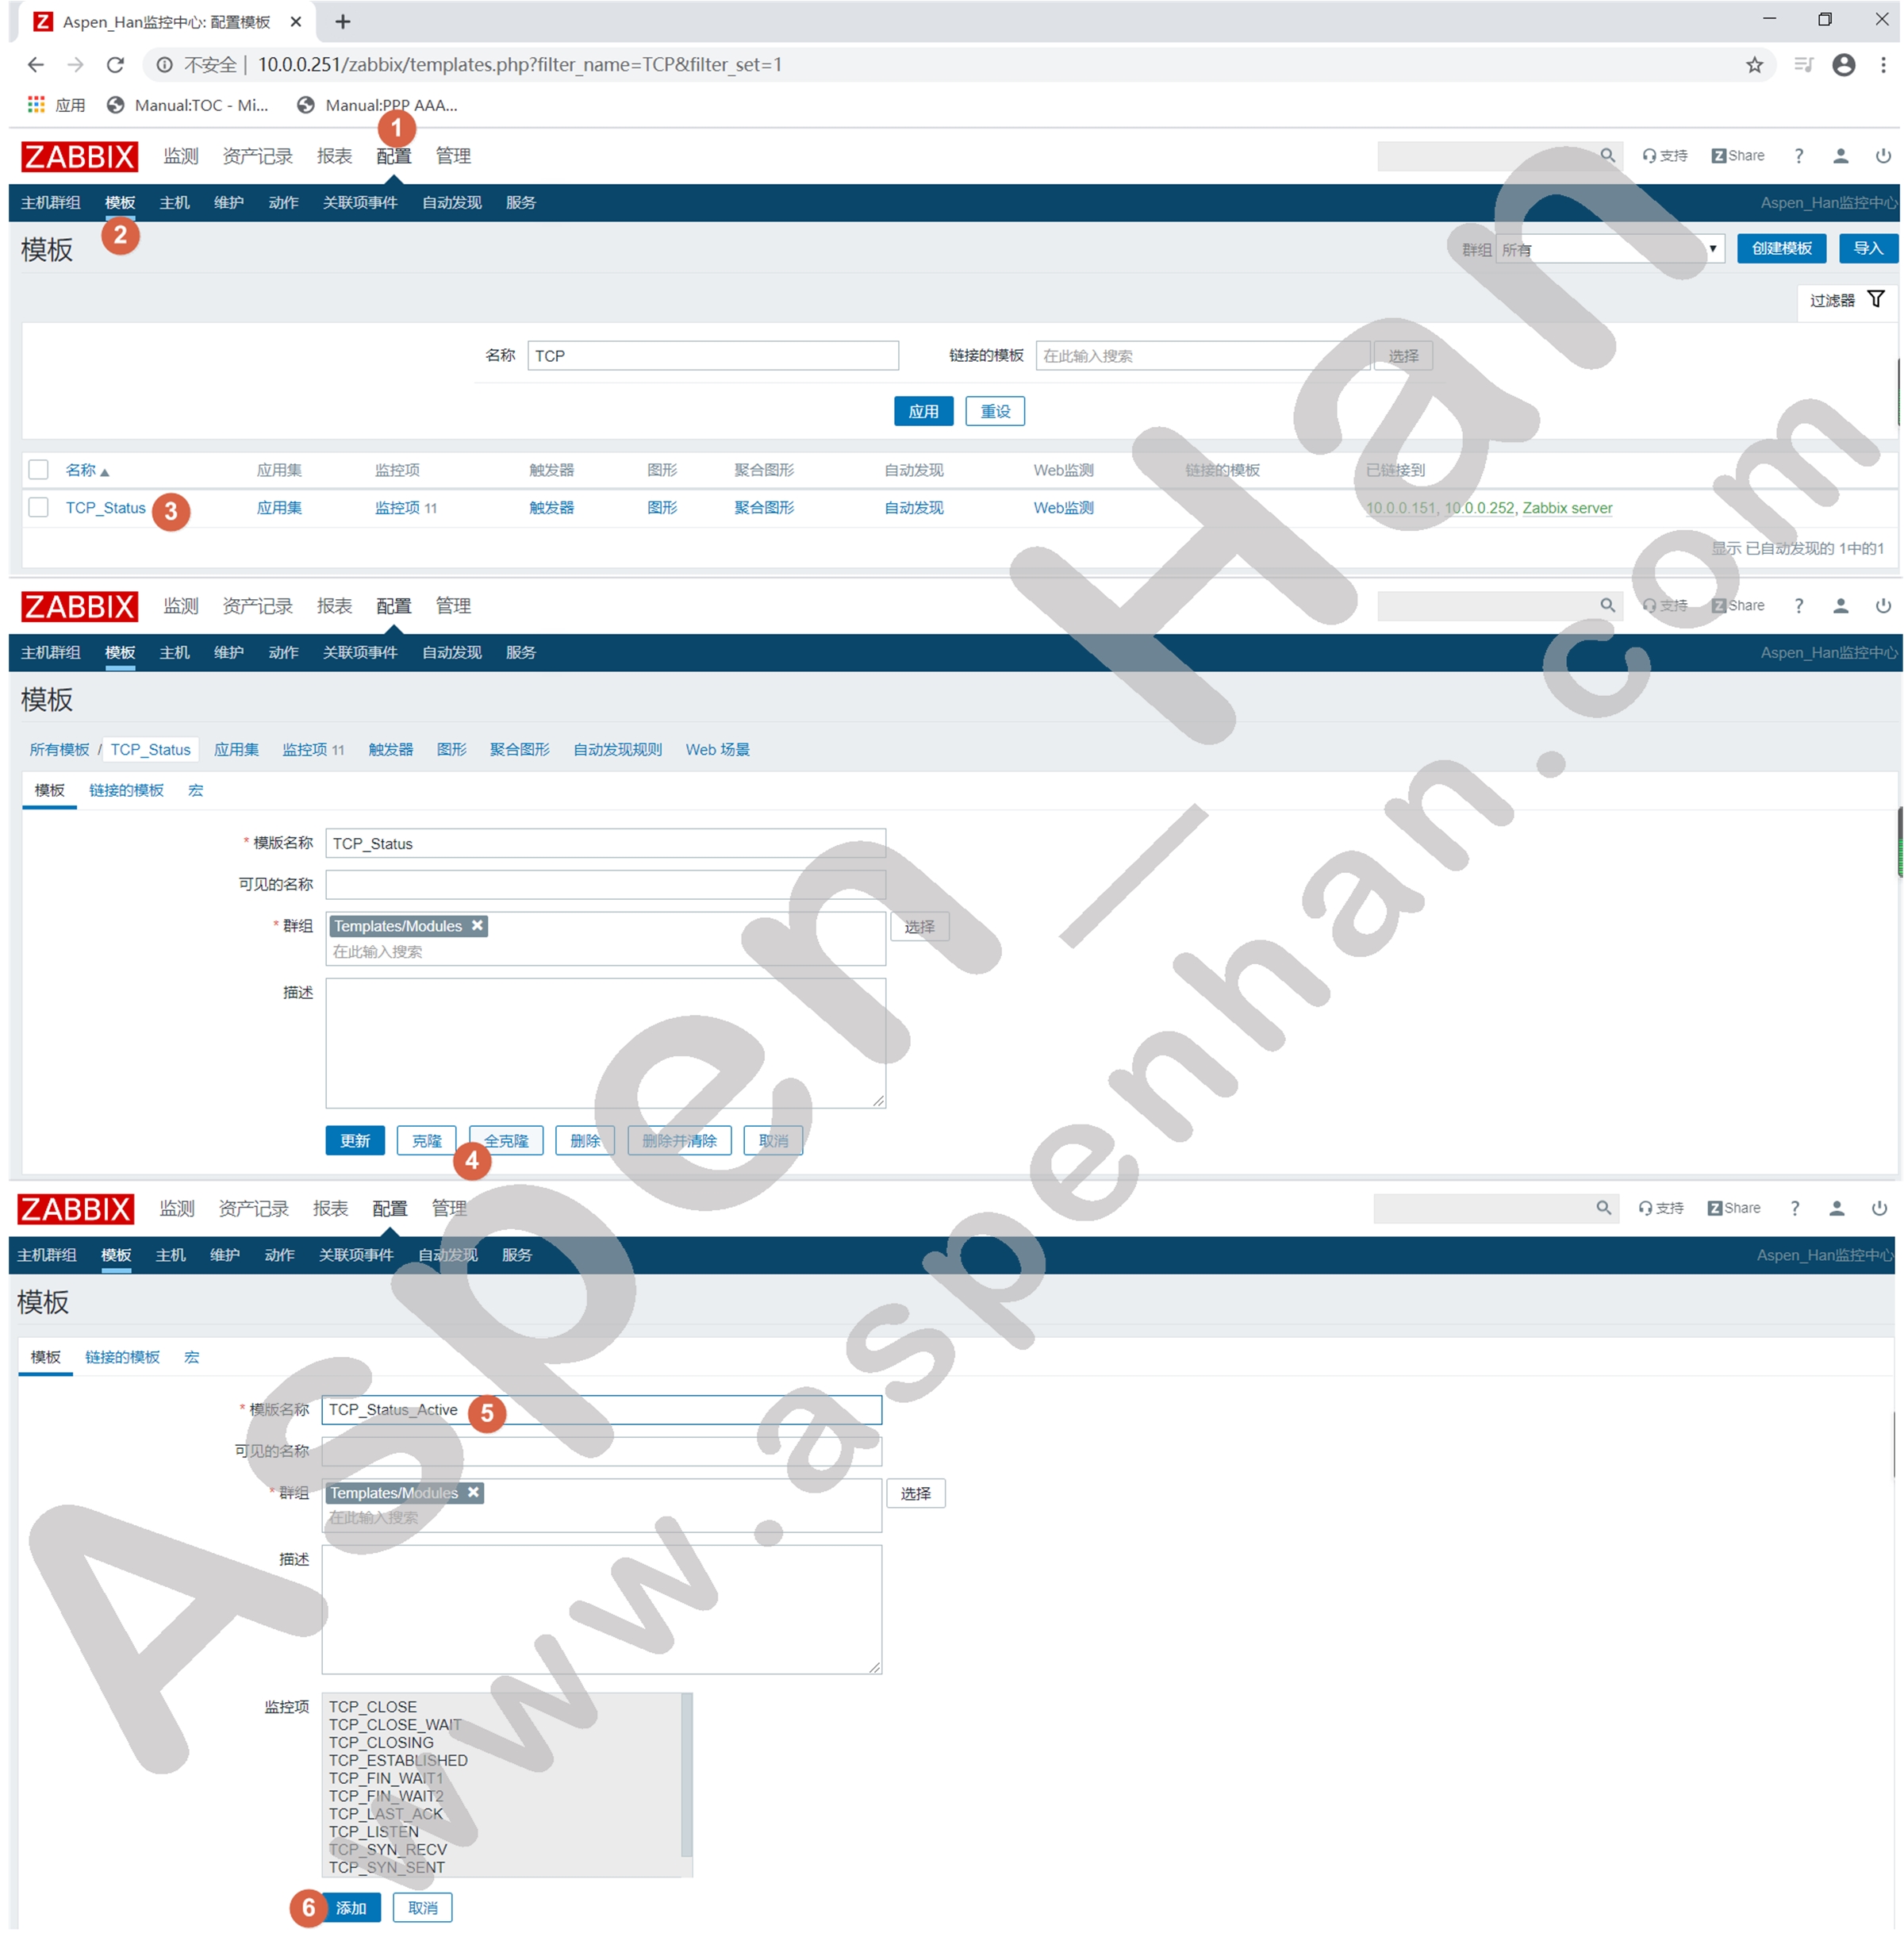
step 2 配置模版主动模式
如果所有监控项全部转换为主动模式,则ZBX图标不会变为绿色,因此模版中至少要保留一个监控项为被动模式
| 配置 -> 模版 -> 特定模版 -> 监控项 -> 批量更改 |

step 3 主机关联主动模式模版
| 配置 -> 主机 -> 特定主机 -> 模板 |
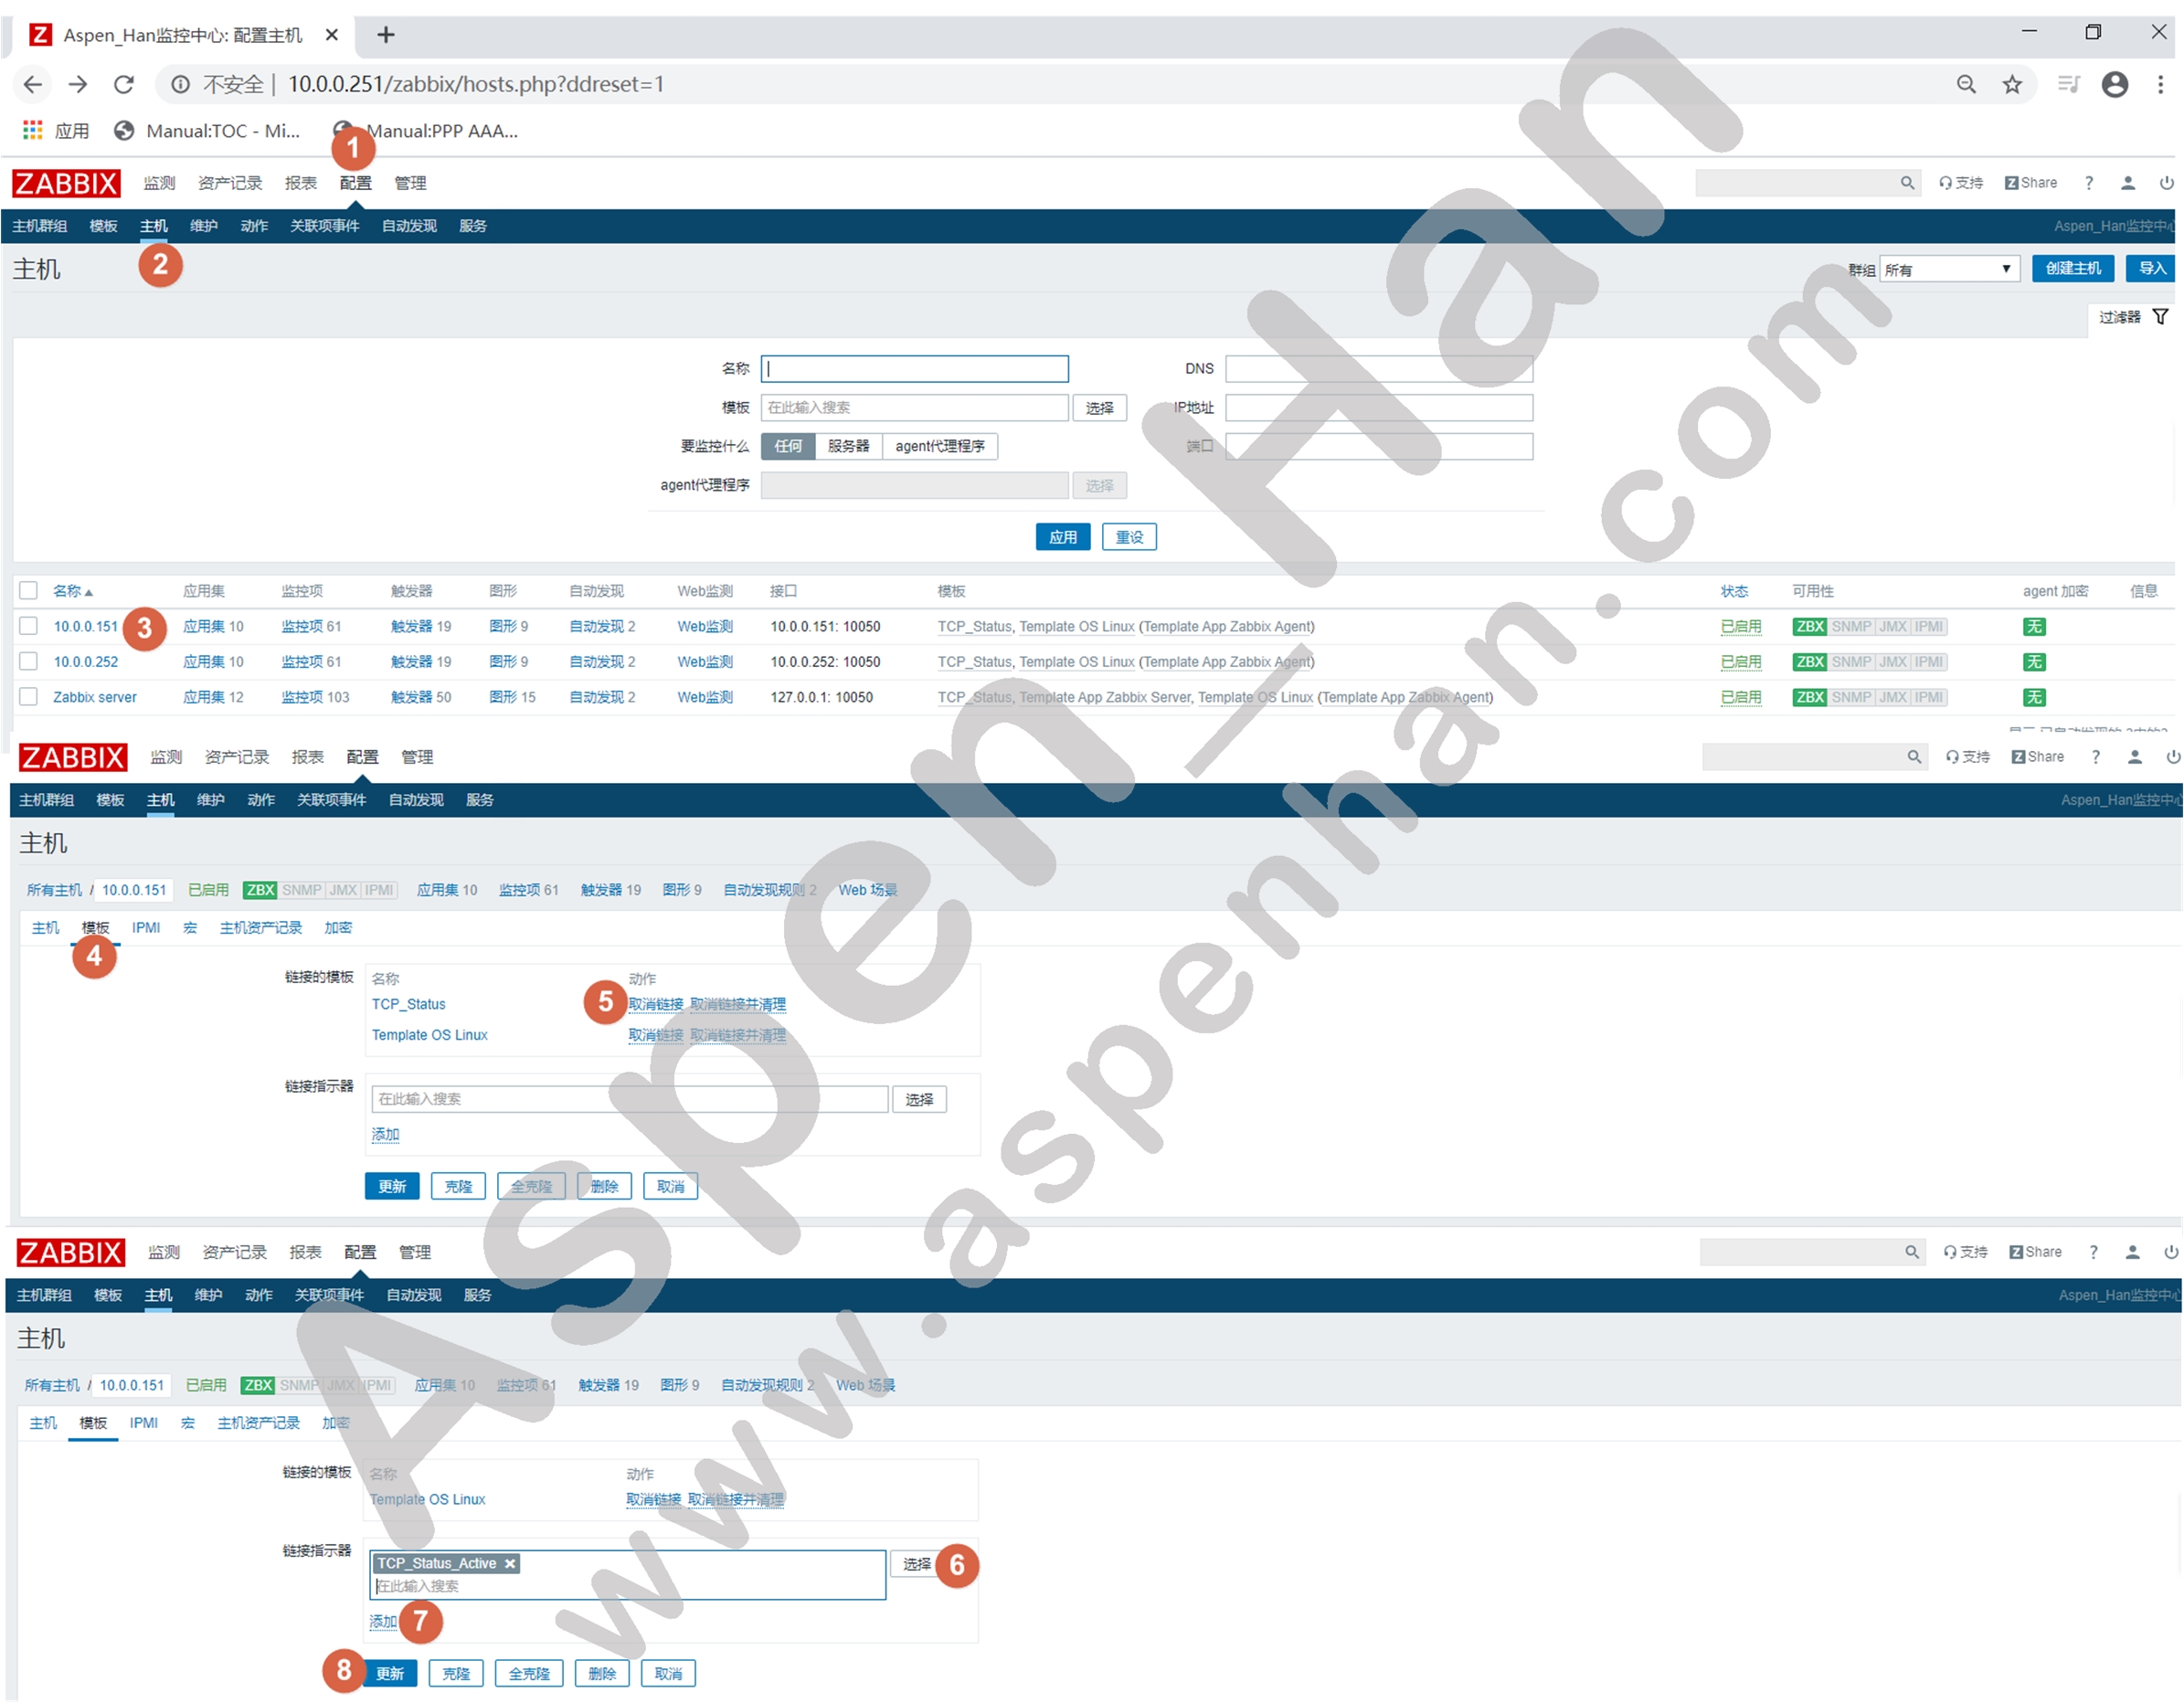
验证
八、Zabbix扩展架构
1. Zabbix版本升级
|
版本升级的优势 a.优化软件性能 b.美化UI c.丰富功能; d.解决版本兼容问题 |
step 1 备份数据库
| mysqldump -u用户名 -p密码 -B 数据库名称 >备份文件.sql |
[root@test /etc/nginx]# mysqldump -uroot -p123456 -B zabbix >/tmp/zabbix_backup.sql
[root@test /etc/nginx]# ls /tmp/*.sql
/tmp/zabbix_backup.sql
step 2 卸载旧版本Zabbix-release
| rpm -e zabbix-release-*.noarch |
[root@test /etc/nginx]# rpm -e zabbix-release-*.noarch
[root@test /etc/nginx]# rpm -qa |grep zabbix
zabbix-2.2.23-1.el7.x86_64
zabbix-web-2.2.23-1.el7.noarch
zabbix-server-2.2.23-1.el7.x86_64
zabbix-web-mysql-2.2.23-1.el7.noarch
zabbix-server-mysql-2.2.23-1.el7.x86_64
step 3 安装Zabbix官方源
| rpm -ivh https://mirror.tuna.tsinghua.edu.cn/zabbix/zabbix/4.0/rhel/7/x86_64/zabbix-release-*.rpm |
[root@test /etc/nginx]# rpm -ivh https://mirror.tuna.tsinghua.edu.cn/zabbix/zabbix/4.0/rhel/7/x86_64/zabbix-release-4.0-2.el7.noarch.rpm
Retrieving https://mirror.tuna.tsinghua.edu.cn/zabbix/zabbix/4.0/rhel/7/x86_64/zabbix-release-4.0-2.el7.noarch.rpm
warning: /var/tmp/rpm-tmp.x7eqib: Header V4 RSA/SHA512 Signature, key ID a14fe591: NOKEY
Preparing...                          ################################# [100%]
Updating / installing...
   1:zabbix-release-4.0-2.el7         ################################# [100%]
step 4 将官方仓库地址替换为清华仓库地址
| sed -i 's#http://repo.zabbix.com#https://mirror.tuna.tsinghua.edu.cn/zabbix#g' /etc/yum.repos.d/zabbix.repo |
[root@test /etc/nginx]# cd /etc/yum.repos.d/
[root@test /etc/yum.repos.d]# sed -i 's#http://repo.zabbix.com/#https://mirror.tuna.tsinghua.edu.cn/zabbix/#g' zabbix.repo
[root@test /etc/yum.repos.d]# cat zabbix.repo
[zabbix]
name=Zabbix Official Repository - $basearch
baseurl=https://mirror.tuna.tsinghua.edu.cn/zabbix/zabbix/4.0/rhel/7/$basearch/
enabled=1
gpgcheck=1
gpgkey=file:///etc/pki/rpm-gpg/RPM-GPG-KEY-ZABBIX-A14FE591

[zabbix-debuginfo]
name=Zabbix Official Repository debuginfo - $basearch
baseurl=https://mirror.tuna.tsinghua.edu.cn/zabbix/zabbix/4.0/rhel/7/$basearch/debuginfo/
enabled=0
gpgkey=file:///etc/pki/rpm-gpg/RPM-GPG-KEY-ZABBIX-A14FE591
gpgcheck=1

[zabbix-non-supported]
name=Zabbix Official Repository non-supported - $basearch
baseurl=https://mirror.tuna.tsinghua.edu.cn/zabbix/non-supported/rhel/7/$basearch/
enabled=1
gpgkey=file:///etc/pki/rpm-gpg/RPM-GPG-KEY-ZABBIX
gpgcheck=1
step 5 升级Zabbix服务端和Zabbix-Web端
| yum install -y zabbix-server-mysql zabbix-web-mysql |
[root@test /etc/yum.repos.d]# yum install -y zabbix-server-mysql zabbix-web-mysql
Loaded plugins: fastestmirror
......
Replaced:
  zabbix.x86_64 0:2.2.23-1.el7             zabbix-server.x86_64 0:2.2.23-1.el7

Complete!
step 6 重启Zabbix Server和httpd服务
| systemctl restart zabbix-server httpd |
[root@test /etc/yum.repos.d]# systemctl restart zabbix-server.service httpd.service
[root@test /etc/yum.repos.d]# tail -40 /var/log/zabbix/zabbix_server.log | head -9
  9037:20200224:150849.191 completed 94% of event name update
  9037:20200224:150849.191 completed 95% of event name update
  9037:20200224:150849.191 completed 96% of event name update
  9037:20200224:150849.191 completed 97% of event name update
  9037:20200224:150849.191 completed 98% of event name update
  9037:20200224:150849.191 completed 99% of event name update
  9037:20200224:150849.191 completed 100% of event name update
  9037:20200224:150849.203 event name update completed
  9057:20200224:150849.232 server #11 started [proxy poller #1]
2. Zabbix Proxy
step 1 安装Zabbix官方源
| rpm -ivh https://mirror.tuna.tsinghua.edu.cn/zabbix/zabbix/4.0/rhel/7/x86_64/zabbix-release-*.rpm |
[root@zabbix-proxy ~]# rpm -ivh https://mirrors.tuna.tsinghua.edu.cn/zabbix/zabbix/4.0/rhel/7/x86_64/zabbix-release-4.0-2.el7.noarch.rpm
Retrieving https://mirrors.tuna.tsinghua.edu.cn/zabbix/zabbix/4.0/rhel/7/x86_64/zabbix-release-4.0-2.el7.noarch.rpm
warning: /var/tmp/rpm-tmp.iuq8pJ: Header V4 RSA/SHA512 Signature, key ID a14fe591: NOKEY
Preparing...                          ################################# [100%]
Updating / installing...
   1:zabbix-release-4.0-2.el7         ################################# [100%]
step 2 将官方仓库地址替换为清华仓库地址
| sed -i 's#http://repo.zabbix.com#https://mirror.tuna.tsinghua.edu.cn/zabbix#g' /etc/yum.repos.d/zabbix.repo |
[root@zabbix-proxy ~]# sed -i 's#http://repo.zabbix.com#https://mirror.tuna.tsinghua.edu.cn/zabbix#g' /etc/yum.repos.d/zabbix.repostep 3 安装zabbix-proxy(mysql版)
本文以MariaDB为例
| yum install -y zabbix-proxy-mysql |
[root@zabbix-proxy ~]# yum install -y zabbix-proxy-mysql
Loaded plugins: fastestmirror
Determining fastest mirrors
Installed:
  zabbix-proxy-mysql.x86_64 0:4.0.18-1.el7
......
Dependency Installed:
  OpenIPMI.x86_64 0:2.0.27-1.el7                     OpenIPMI-libs.x86_64 0:2.0.27-1.el7
  OpenIPMI-modalias.x86_64 0:2.0.27-1.el7            fping.x86_64 0:3.10-4.el7
  libevent.x86_64 0:2.0.21-4.el7                     net-snmp-libs.x86_64 1:5.7.2-43.el7_7.3
  unixODBC.x86_64 0:2.3.1-14.el7

Complete!
step 4 安装mariaDB
| yum install -y mariadb-server |
[root@zabbix-proxy ~]# yum install -y mariadb-server.x86_64
Loaded plugins: fastestmirror
Loading mirror speeds from cached hostfile
......
Dependency Updated:
  mariadb-libs.x86_64 1:5.5.64-1.el7

Complete!
[root@zabbix-proxy ~]# systemctl start mariadb.service
step 5 创建zabbix数据库及账户
| Zabbix-Proxy与Zabbix-Server数据库不通用 |
|
create database 数据库名称 character set utf8 collate utf8_bin; grant all privileges on 数据库名称.* to 用户名@授权主机 identified by '密码'; |
MariaDB [(none)]> create database zabbix_proxy character set utf8 collate utf8_bin;
Query OK, 1 row affected (0.00 sec)

MariaDB [(none)]> grant all on zabbix_proxy.* to "zabbix"@"localhost" identified by '123456';
Query OK, 0 rows affected (0.00 sec)
[root@zabbix-proxy ~]# mysql -uzabbix -p123456 zabbix_proxy
Welcome to the MariaDB monitor.  Commands end with ; or \g.
Your MariaDB connection id is 5
Server version: 5.5.64-MariaDB MariaDB Server

Copyright (c) 2000, 2018, Oracle, MariaDB Corporation Ab and others.

Type 'help;' or '\h' for help. Type '\c' to clear the current input statement.

MariaDB [zabbix_proxy]>
step 6 导入Zabbix表结构及初始数据
| zcat /usr/share/doc/zabbix-proxy-mysql*/schema.sql.gz | mysql -u用户名 -p密码 数据库名称 |
[root@zabbix-proxy ~]# rpm -ql zabbix-proxy-mysql| grep sql.gz
/usr/share/doc/zabbix-proxy-mysql-4.0.18/schema.sql.gz
[root@zabbix-proxy ~]# zcat /usr/share/doc/zabbix-proxy-mysql-4.0.18/schema.sql.gz |mysql -uzabbix -p123456 zabbix_proxy
[root@zabbix-proxy ~]# mysql -uzabbix -p123456 zabbix_proxy -e "show tables;" | head -5
Tables_in_zabbix_proxy
acknowledges
actions
alerts
application_discovery
[root@zabbix-proxy ~]# mysql -uzabbix -p123456 zabbix_proxy -e "show tables;" | wc -l
145
step 7 配置zabbix-proxy
|
# /etc/zabbix/zabbix_proxy.conf ProxyMode=0 #指定Proxy为主动工作模式 Server=IP地址 #指定Zabbix-Server地址 ServerPort=端口 #指定Zabbix-Proxy工作端口(默认端口:10051) Hostname=名称 #指定Zabbix-Proxy名称 DBHost=IP地址 DBName=数据库名称 DBUser=数据库用户 DBPassword=数据库密码 HeartbeatFrequency=时间 #指定proxy心跳检测频率(单位:秒) ConfigFrequency=时间 #指定proxy同步Server配置频率(单位:秒) DataSenderFrequency=时间 #指定proxy向Server提交数据频率(单位:秒) |
[root@zabbix-proxy ~]# grep -Ev '^$|#' /etc/zabbix/zabbix_proxy.conf
ProxyMode=0
Server=10.0.0.251
ServerPort=10051
Hostname=sy_proxy
LogFile=/var/log/zabbix/zabbix_proxy.log
LogFileSize=0
PidFile=/var/run/zabbix/zabbix_proxy.pid
SocketDir=/var/run/zabbix
DBHost=localhost
DBName=zabbix_proxy
DBUser=zabbix
DBPassword=123456
HeartbeatFrequency=60
ConfigFrequency=60
DataSenderFrequency=1
SNMPTrapperFile=/var/log/snmptrap/snmptrap.log
Timeout=4
ExternalScripts=/usr/lib/zabbix/externalscripts
LogSlowQueries=3000
step 8 启动zabbix-proxy
| systemctl start proxy |
[root@zabbix-proxy ~]# systemctl restart zabbix-proxy.service
[root@zabbix-proxy ~]# systemctl status zabbix-proxy.service | head -5
● zabbix-proxy.service - Zabbix Proxy
Loaded: loaded (/usr/lib/systemd/system/zabbix-proxy.service; disabled; vendor preset: disabled)
Active: active (running) since Mon 2020-03-02 16:38:46 CST; 5s ago
Process: 8883 ExecStop=/bin/kill -SIGTERM $MAINPID (code=exited, status=0/SUCCESS)
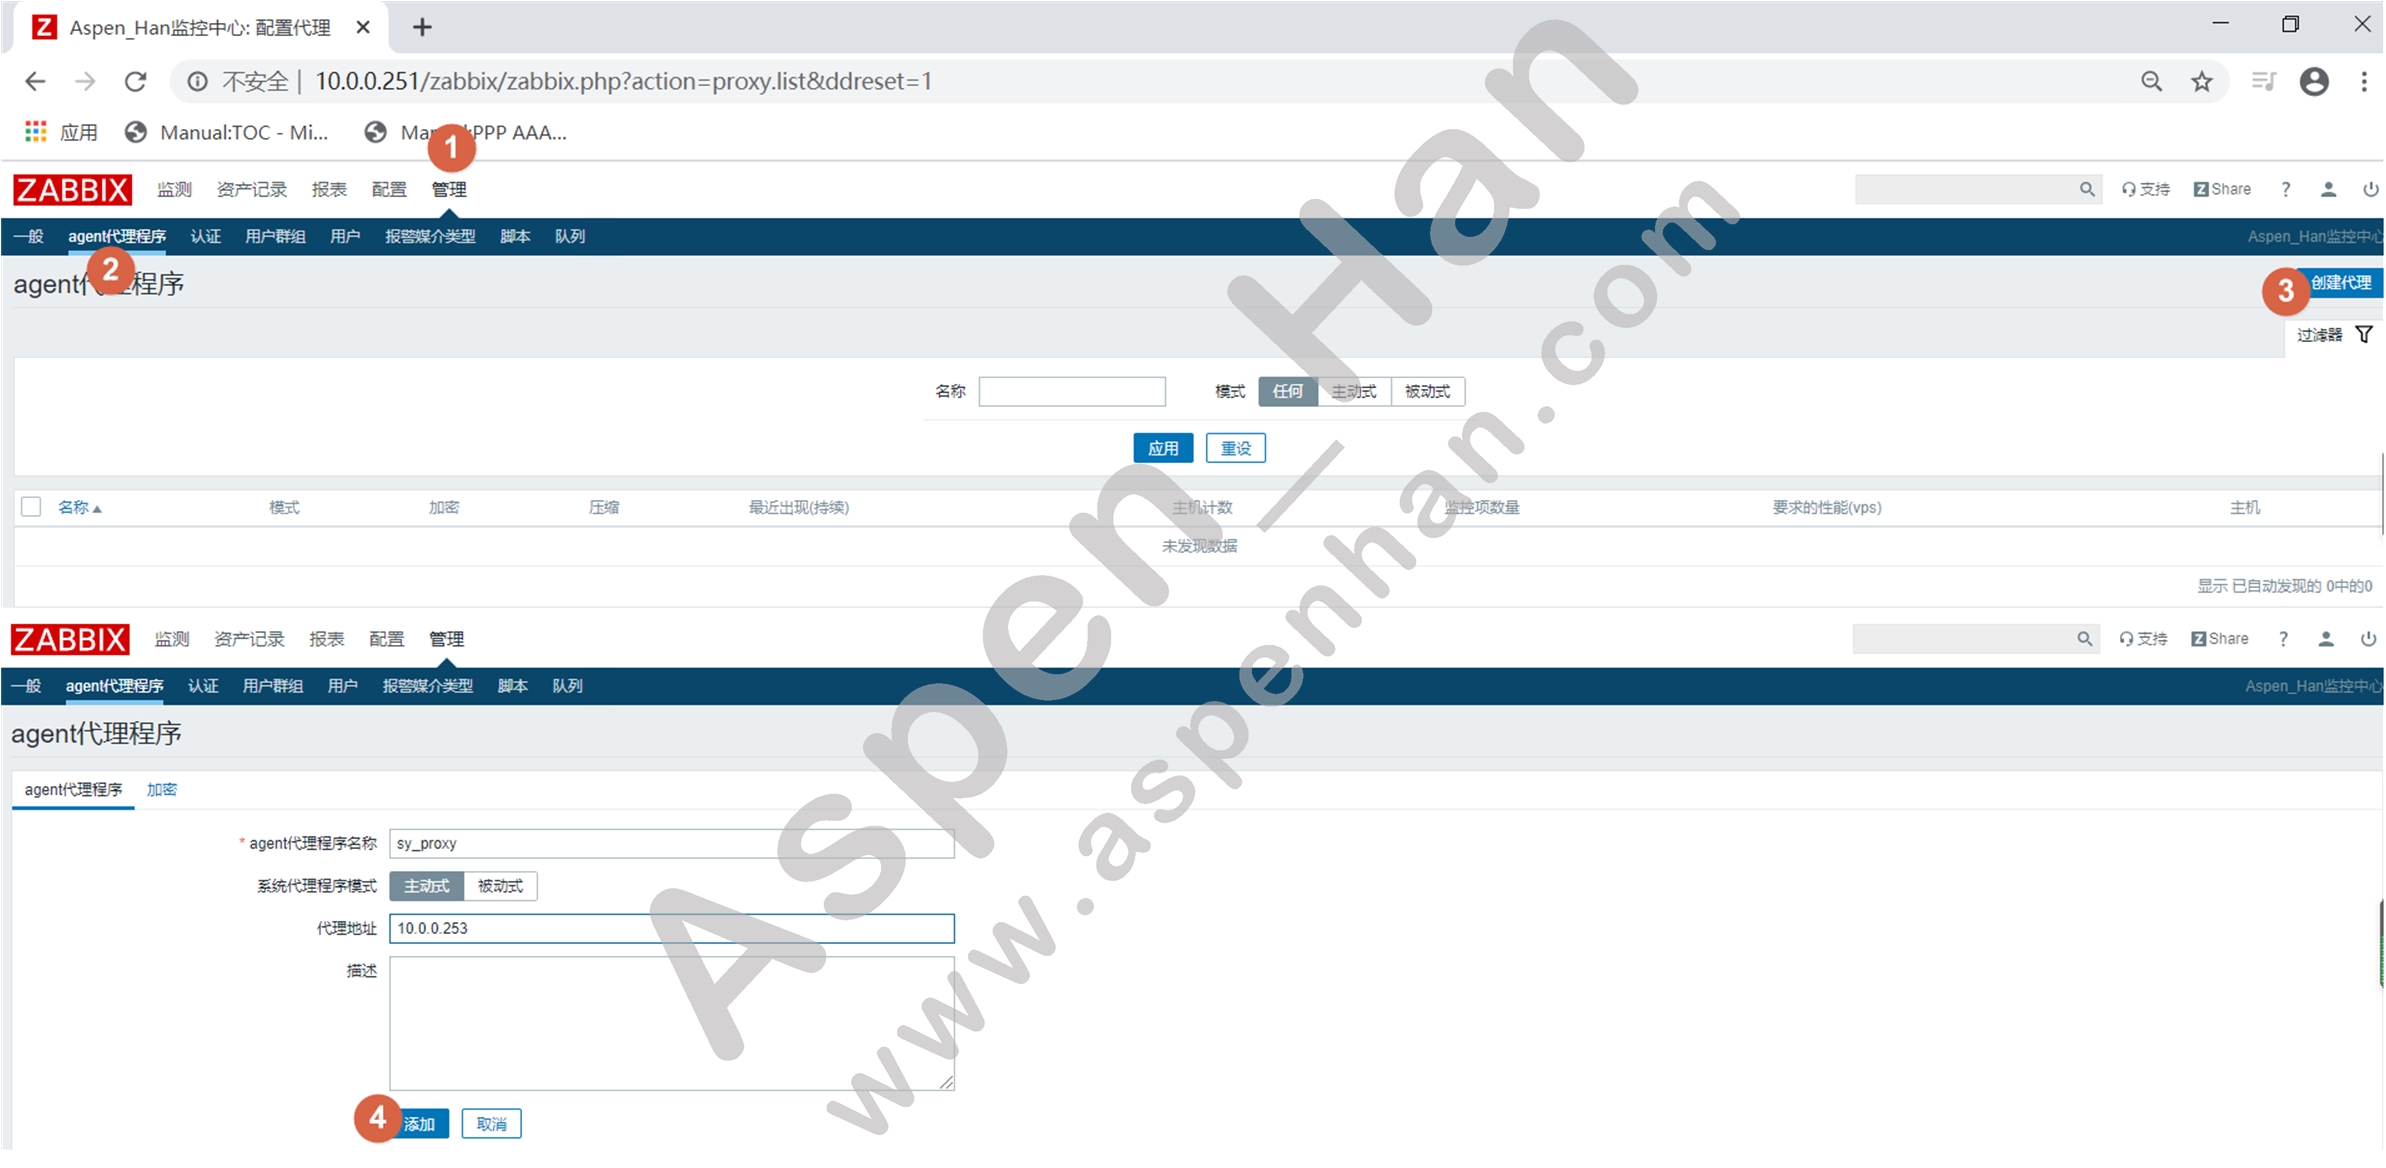
Process: 8886 ExecStart=/usr/sbin/zabbix_proxy -c $CONFFILE (code=exited, status=0/SUCCESS)step 9 Web端添加Porxy
| 管理 -> agent代理程序 -> 创建代理 |
step 10 配置Agent
|
# /etc/zabbix/zabbix_agentd.conf Server=IP地址 #指定Zabbix-Proxy的IP地址 ServerActive=IP地址 #指定自动注册地址(proxy地址) Hostname=主机名 #指定主机名 HostMetadata=元数据 #指定元数据标签 |
[root@zabbix-web /]# grep -Ev '^$|#'  /etc/zabbix/zabbix_agentd.conf
PidFile=/var/run/zabbix/zabbix_agentd.pid
LogFile=/var/log/zabbix/zabbix_agentd.log
LogFileSize=0
Server=172.16.1.253
ServerActive=172.16.1.253
Hostname=172.16.1.252
HostMetadata=web
Include=/etc/zabbix/zabbix_agentd.d/*.conf
[root@zabbix-web /]# systemctl restart zabbix-agent.service
3.Zabbix高可用
| 在Zabbix高可用架构中,主备zabbix-server要保证数据一致,建议使用同一个数据库; |
step 1 安装keepalive和sshpass
| yum install -y keepalived sshpass |
[root@zabbix-server01 ~]# yum install -y sshpass.x86_64 keepalived.x86_64
Loaded plugins: fastestmirror
Loading mirror speeds from cached hostfile
......
Installed:
  keepalived.x86_64 0:1.3.5-19.el7                     sshpass.x86_64 0:1.06-2.el7

Dependency Installed:
  net-snmp-agent-libs.x86_64 1:5.7.2-49.el7_9.1

Dependency Updated:
  ipset.x86_64 0:7.1-1.el7                        ipset-libs.x86_64 0:7.1-1.el7

Complete!
[root@zabbix-server02 ~]# yum install -y sshpass.x86_64 keepalived.x86_64
Loaded plugins: fastestmirror
Determining fastest mirrors
......
Installed:
keepalived.x86_64 0:1.3.5-19.el7 sshpass.x86_64 0:1.06-2.el7
Dependency Installed:
net-snmp-agent-libs.x86_64 1:5.7.2-49.el7_9.1
Dependency Updated:
ipset.x86_64 0:7.1-1.el7 ipset-libs.x86_64 0:7.1-1.el7
Complete!step 2 准备主从切换脚本
|
#!/bin/bash sshpass -p 密码 ssh -o StrictHostKeyChecking=no root@IP地址 "systemctl stop zabbix-server.service" systemctl restart zabbix-server.service |
[root@zabbix-server01 ~]# cat /opt/switch_service.sh
#!/bin/bash
sshpass -p 123456 ssh -o StrictHostKeyChecking=No root@10.0.0.252 "systemctl stop zabbix-server.service"
systemctl restart zabbix-server.service
[root@zabbix-server02 ~]# scp -rp root@10.0.0.251:/opt/* /opt/
root@10.0.0.251's password:
switch_service.sh 100% 157 179.7KB/s 00:00
[root@zabbix-server02 ~]# sed s#root@10.0.0.252#root@10.0.0.251#g /opt/switch_service.sh
#!/bin/bash
sshpass -p 123456 ssh -o StrictHostKeyChecking=No root@10.0.0.251 "systemctl stop zabbix-server.service"
systemctl restart zabbix-server.service
[root@zabbix-server02 ~]# sed -i s#root@10.0.0.252#root@10.0.0.251#g /opt/switch_service.sh
[root@zabbix-server02 ~]# cat /opt/switch_service.sh
#!/bin/bash
sshpass -p 123456 ssh -o StrictHostKeyChecking=No root@10.0.0.251 "systemctl stop zabbix-server.service"
systemctl restart zabbix-server.servicestep 3 授权脚本
| chmod +x 脚本 |
[root@zabbix-server01 ~]# chmod +x /opt/switch_service.sh
[root@zabbix-server01 ~]# ll /opt/switch_service.sh
-rwxr-xr-x 1 root root 157 Sep 29 13:15 /opt/switch_service.sh
[root@zabbix-server02 ~]# chmod +x /opt/switch_service.sh
[root@zabbix-server02 ~]# ll /opt/switch_service.sh
-rwxr-xr-x 1 root root 157 Sep 29 13:17 /opt/switch_service.shstep 4 配置keepalived
|
#/etc/keepalived/keepalived.conf
global_defs {
router_id 设备标识符 #定义设备标识符
}
vrrp_instance 实例名 { #指定vrrp实例名称
state BACKUP #指定节点角色
interface 网卡接口 #指定绑定网卡
virtual_router_id n #指定vrrp实例ID
priority n #指定本机优先级
advert_int n #指定vrrp实现宣告时间
authentication {
auth_type PASS #指定为密码验证类型
auth_pass 密码 #指定验证密码
}
vitual_ipaddress {
IP地址 #指定虚拟IP地址
}
notify_master 脚本
} |
[root@zabbix-server01 ~]# cat /etc/keepalived/keepalived.conf
! Configuration File for keepalived

global_defs {
   router_id Zabbix_Server01
}

vrrp_instance VI_1 {
    state BACKUP
    interface eth0
    virtual_router_id 51
    priority 100
    advert_int 1
    authentication {
        auth_type PASS
        auth_pass 1111
    }
    virtual_ipaddress {
        10.0.0.250
    }
notify_master /opt/switch_service.sh
}
[root@zabbix-server02 ~]# cat /etc/keepalived/keepalived.conf
! Configuration File for keepalived
global_defs {
router_id Zabbix_Server02
}
vrrp_instance VI_1 {
state BACKUP
interface eth0
virtual_router_id 51
priority 80
advert_int 1
authentication {
auth_type PASS
auth_pass 1111
}
virtual_ipaddress {
10.0.0.250
}
notify_master /opt/switch_service.sh
}step 5 启动keepalived
| systemctl start keepalived |
[root@zabbix-server01 ~]# systemctl start keepalived.service
[root@zabbix-server01 ~]# systemctl status keepalived.service | head -5
● keepalived.service - LVS and VRRP High Availability Monitor
   Loaded: loaded (/usr/lib/systemd/system/keepalived.service; enabled; vendor preset: disabled)
   Active: active (running) since Wed 2021-09-29 13:22:03 CST; 11s ago
  Process: 9480 ExecStart=/usr/sbin/keepalived $KEEPALIVED_OPTIONS (code=exited, status=0/SUCCESS)
 Main PID: 9481 (keepalived)
[root@zabbix-server02 ~]# systemctl start keepalived.service
[root@zabbix-server02 ~]# systemctl status keepalived.service | head -5
● keepalived.service - LVS and VRRP High Availability Monitor
Loaded: loaded (/usr/lib/systemd/system/keepalived.service; enabled; vendor preset: disabled)
Active: active (running) since Wed 2021-09-29 13:22:54 CST; 11s ago
Process: 9314 ExecStart=/usr/sbin/keepalived $KEEPALIVED_OPTIONS (code=exited, status=0/SUCCESS)
Main PID: 9315 (keepalived)[root@zabbix-server01 ~]# systemctl status zabbix-server.service | head -3
● zabbix-server.service - Zabbix Server
Loaded: loaded (/usr/lib/systemd/system/zabbix-server.service; disabled; vendor preset: disabled)
Active: active (running) since Wed 2021-09-29 13:22:08 CST; 9min ago
[root@zabbix-server01 ~]# systemctl stop keepalived.service
[root@zabbix-server01 ~]# ip a show eth0 | grep 10.0.0.250
[root@zabbix-server01 ~]# systemctl status zabbix-server.service | head -3
● zabbix-server.service - Zabbix Server
Loaded: loaded (/usr/lib/systemd/system/zabbix-server.service; disabled; vendor preset: disabled)
Active: inactive (dead)
[root@zabbix-server01 ~]# systemctl restart keepalived.service
[root@zabbix-server01 ~]# systemctl status zabbix-server.service | head -3
● zabbix-server.service - Zabbix Server
Loaded: loaded (/usr/lib/systemd/system/zabbix-server.service; disabled; vendor preset: disabled)
Active: active (running) since Wed 2021-09-29 13:48:09 CST; 1s agostep 6 修改zabbix-server配置文件
|
# /etc/zabbix/zabbix_server.conf DBHost=IP地址 #指定数据库用户登录授权主机地址 DBName=数据库名称 #指定连接数据库名称 DBUser=数据库用户 #指定连接数据库用户名 DBPassword=数据库密码 #指定连接数据库密码 SourceIP=IP地址 #指定server端出口IP地址 |
[root@zabbix-server01 ~]# grep -Ev '^$|#' /etc/zabbix/zabbix_server.conf
SourceIP=10.0.0.250
LogFile=/var/log/zabbix/zabbix_server.log
LogFileSize=0
PidFile=/var/run/zabbix/zabbix_server.pid
SocketDir=/var/run/zabbix
DBHost=10.0.0.253
DBName=zabbix
DBUser=zabbix
DBPassword= 123456
SNMPTrapperFile=/var/log/snmptrap/snmptrap.log
Timeout=4
AlertScriptsPath=/usr/lib/zabbix/alertscripts
ExternalScripts=/usr/lib/zabbix/externalscripts
LogSlowQueries=3000
[root@zabbix-server02 ~]# grep -Ev '^$|#' /etc/zabbix/zabbix_server.conf
SourceIP=10.0.0.250
LogFile=/var/log/zabbix/zabbix_server.log
LogFileSize=0
PidFile=/var/run/zabbix/zabbix_server.pid
SocketDir=/var/run/zabbix
DBHost=10.0.0.253
DBName=zabbix
DBUser=zabbix
DBPassword=123456
SNMPTrapperFile=/var/log/snmptrap/snmptrap.log
Timeout=4
AlertScriptsPath=/usr/lib/zabbix/alertscripts
ExternalScripts=/usr/lib/zabbix/externalscripts
LogSlowQueries=3000step 7 重启zabbix-server
| systemctl restart zabbix-server |
[root@zabbix-server01 ~]# systemctl restart zabbix-server.service 九、优化与调用
1. Zabbix性能优化
| Zabbix出现性能瓶颈时,其展示的图像会断开;或者查看管理 -> 队列中的数据 |
优化Zabbix数据库性能
Zabbix数据库是一个写多读少的环境
- 升级数据库版本,优化存储引擎(tokudb);
- 升级数据库磁盘性能(RAID10/SSD);
- 减少数据库存储压力:删除无用监控项,增加监控项取值间隔,减少历史数据保存周期;
- 提高存储效率:将zabbix-agent的被动模式改为主动模式;
- 针对zabbix的历史数据和趋势图表进行周期性分表(DBA职责);
- 增加zabbix-proxy(不建议使用);
| Zabbix首页会给出对主机性能的要求,即数据库每秒需要完成数据插入的最低次数;这个阈值随着监控主机和监控项的增加,也会上升; |

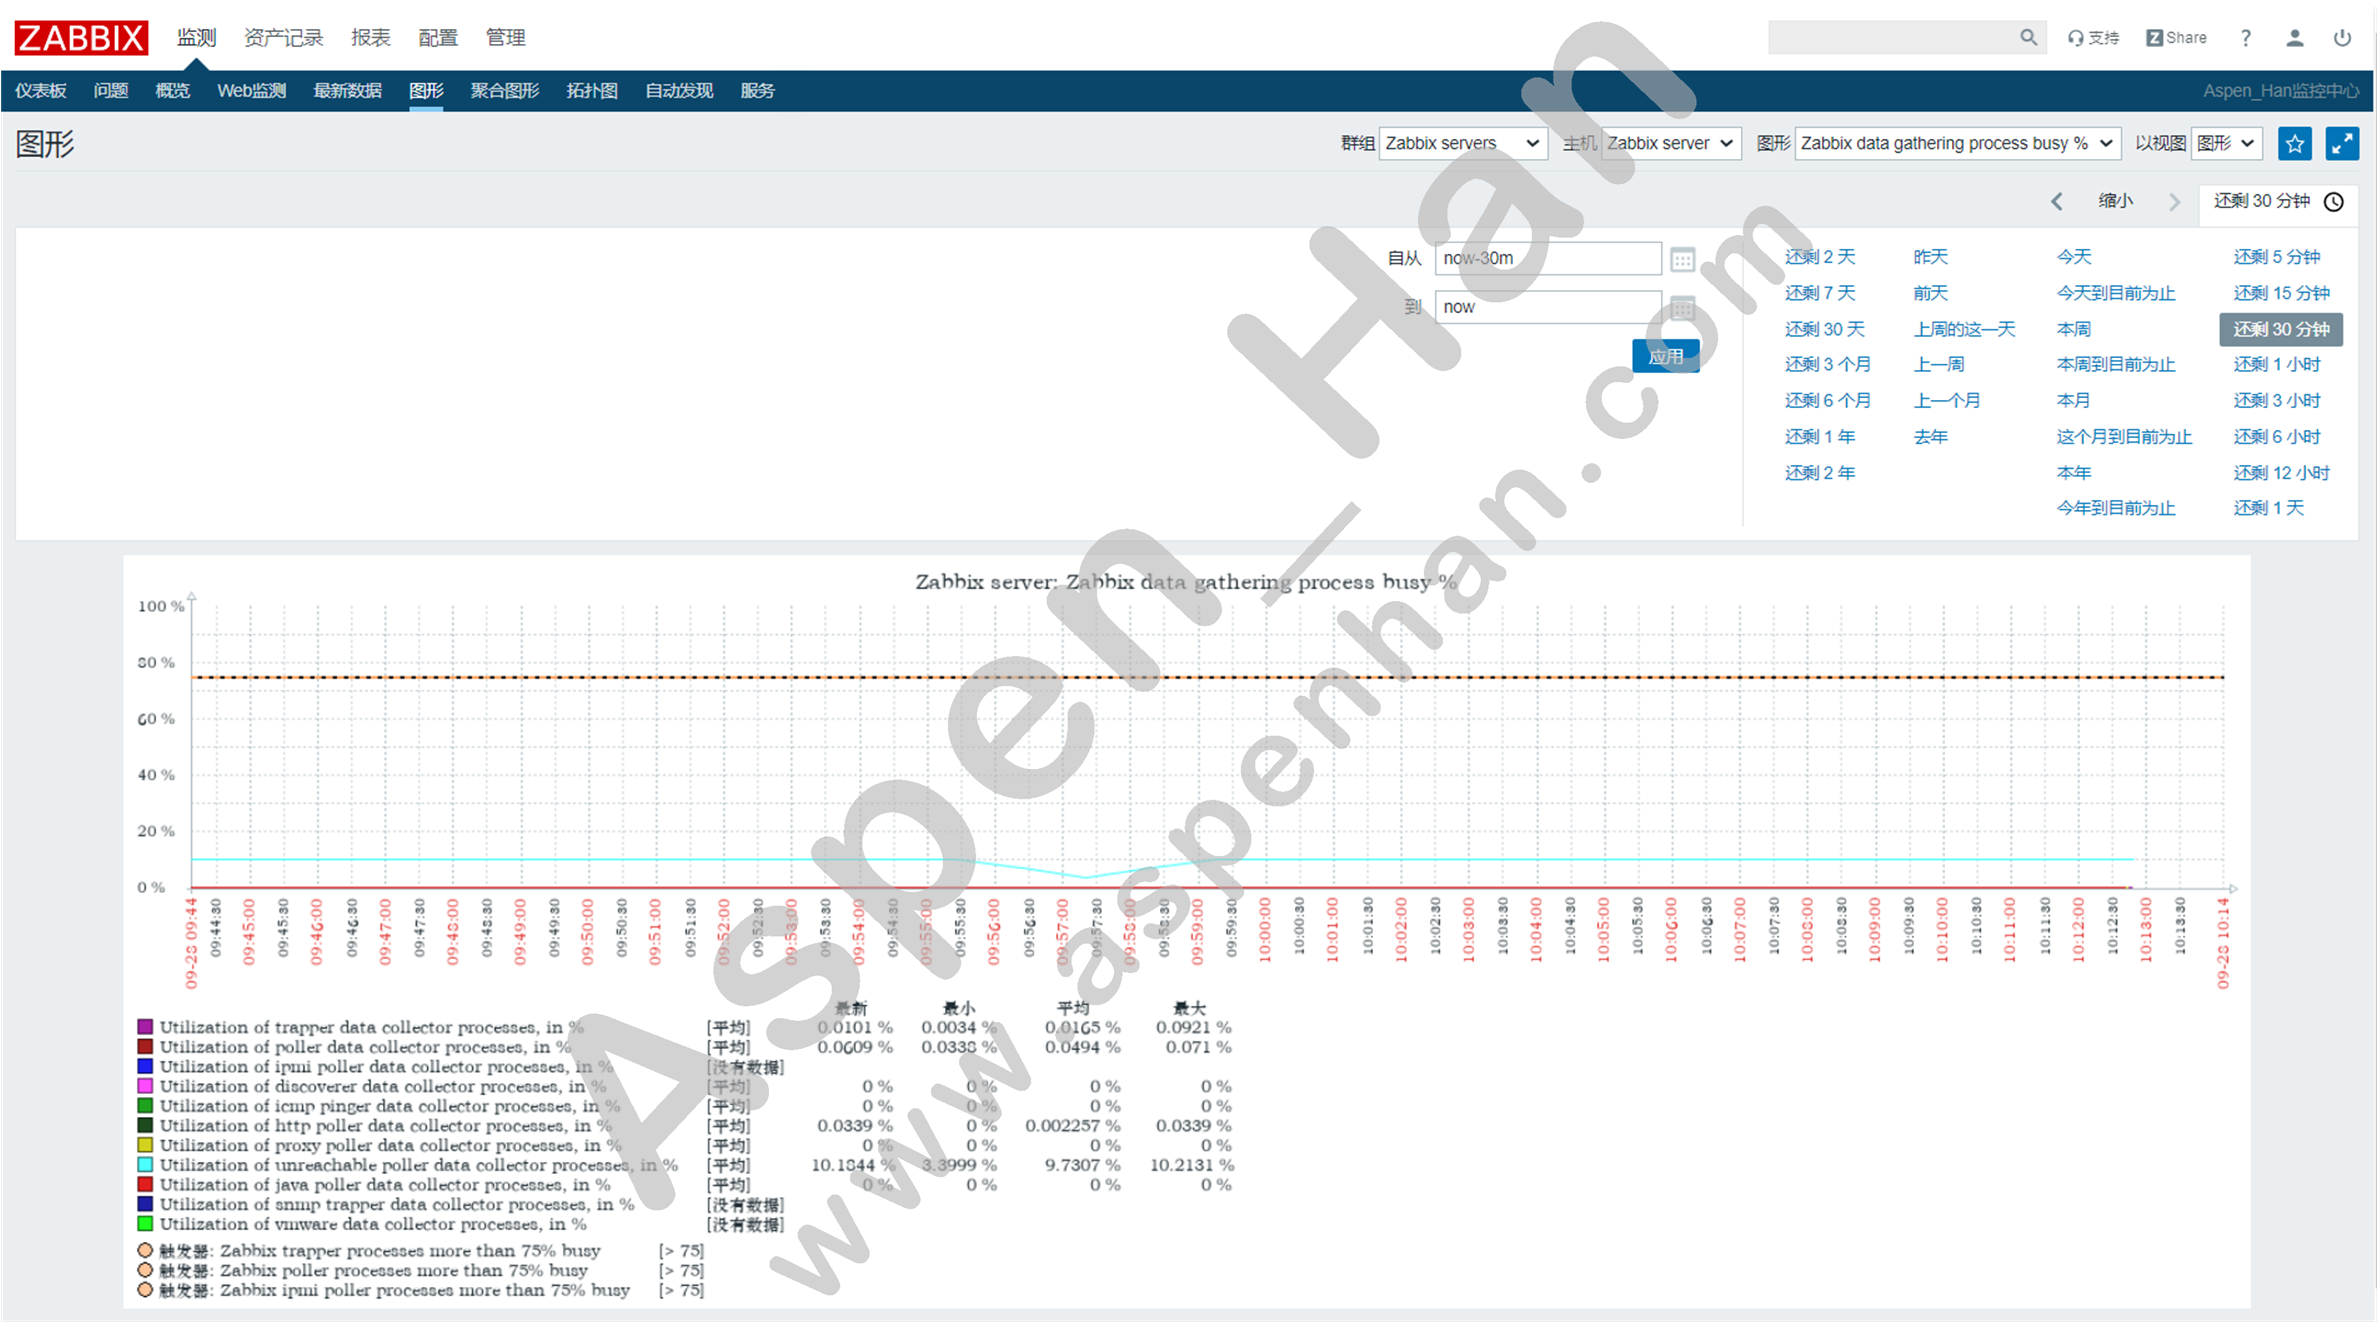
优化Zabbix进程数
针对负载较高的进程,增加进程数量;但请不要无节制的增加进程,每增加一个进程都会增加系统内存的占用
[root@zabbix-server ~]# ps -ef | grep zabbix | wc -l
46
[root@zabbix-server ~]# ps -ef | grep zabbix | head -5
zabbix     7220      1  0 08:44 ?        00:00:00 /usr/sbin/zabbix_agentd -c /etc/zabbix/zabbix_agentd.conf
zabbix     7234   7220  0 08:44 ?        00:00:01 /usr/sbin/zabbix_agentd: collector [idle 1 sec]
zabbix     7235   7220  0 08:44 ?        00:00:00 /usr/sbin/zabbix_agentd: listener #1 [waiting for connection]
zabbix     7236   7220  0 08:44 ?        00:00:00 /usr/sbin/zabbix_agentd: listener #2 [waiting for connection]
zabbix 7237 7220 0 08:44 ? 00:00:00 /usr/sbin/zabbix_agentd: listener #3 [waiting for connection]| 监测 -> 图形 -> zabbix server -> Zabbix data gathering process busy % |
|
# /etc/zabbix/zabbix_server.conf StartDiscoverers=n #指定Discover进程数量 StartJavaPollers=n #指定Java采集器数量 StartDBSyncers=n #指定数据库同步进程数量 ...... |
[root@zabbix-server ~]# grep 'Start' /etc/zabbix/zabbix_server.conf | grep -Ev Option
# StartPollers=5
# StartIPMIPollers=0
# StartPreprocessors=3
# StartPollersUnreachable=1
# StartTrappers=5
# StartPingers=1
# StartDiscoverers=1
# StartHTTPPollers=1
# StartTimers=1
# StartEscalators=1
# StartAlerters=3
StartJavaPollers=5
# StartVMwareCollectors=0
# StartSNMPTrapper=0
# StartDBSyncers=4
# StartProxyPollers=1
优化Zabbix缓存容量
| Zabbix缓存不足时,会导致服务自杀; |
Zabbix Server会缓存触发器表达式,触发器阈值,配置信息、监控主机信息以及一些历史数据
| 监测 -> 图形 -> zabbix server -> Zabbix cache usage, % used |
在实际工作中,各缓存区利用率不宜高于60%。

| zabbix_server -R config_cache_reload #刷新zabbix-server缓存空间 |
[root@zabbix-server ~]# zabbix_server -R config_cache_reload
zabbix_server [19579]: command sent successfully|
# /etc/zabbix/zabbix_server.conf VMwareCacheSize=n #指定VMware的缓存区空间 CacheSize=n #指定配置缓存区空间 CacheUpdateFrequency=n #指定配置缓存更新频率 HistoryCacheSize=n #指定历史数据缓存区空间 HistoryIndexCacheSize=n #指定历史数据索引缓存区空间 TrendCacheSize=n #指定趋势图缓存区空间 ValueCacheSize=n #指定历史数据缓存区空间 ...... |
[root@zabbix-server ~]# grep 'Cache' /etc/zabbix/zabbix_server.conf | grep Option -v
# VMwareCacheSize=8M
# CacheSize=8M
# CacheUpdateFrequency=60
# HistoryCacheSize=16M
# HistoryIndexCacheSize=4M
# TrendCacheSize=4M
# ValueCacheSize=8M
2. Zabbix API
获取Zabbix认证
|
curl -X POST -H "Content-Type: application/json-rpc" -d ' { "jsonrpc": "2.0",
"method": "user.login",
"params": {
"user": "用户名(Admin)",
"password": "密码(zabbix)"
},
"id": 1,
"auth": null
}' https://IP地址/zabbix/api_jsonrpc.php |
[root@zabbix-proxy ~]# curl -X POST -H "Content-Type: application/json-rpc" -d '
> {
>     "jsonrpc": "2.0",
>     "method": "user.login",
>     "params": {
>         "user": "Admin",
>         "password": "zabbix"
>     },
>     "id": 1,
>     "auth": null
> }' http://10.0.0.251/zabbix/api_jsonrpc.php
{"jsonrpc":"2.0","result":"a37a7487df02c28e45e7f598291a6aea","id":1}[root@zabbix-proxy ~]#
应用示例
- 创建主机
|
curl -X POST -H "Content-Type: application/json-rpc" -d ' {
"jsonrpc": "2.0",
"method": "host.create", #声明创建主机
"params": {
"host": "主机名称", #指定创建主机名称
"interfaces": [
{
"type": n, #指定接口类型(agent/SNMP/JMX/ipmi)
"main": 1, #指定该接口为默认接口
"useip": 1, #指定使用IP方式监控主机
"ip": "IP地址", #指定被监控主机IP地址
"dns": "",
"port": "端口" #指定被监控主机的agent端口号
}
],
"groups": [
{
"groupid": "组ID" #指定被监控主机的归属组
}
],
"templates": [
{
"templateid": "模版1-ID" #指定绑定模版1
},
{
"templateid": "模版2-ID" #指定绑定模版2
}
]
},
"auth": "授权码", #指定zabbix授权码
"id": 1
}' https://IP地址/zabbix/api_jsonrpc.php |
[root@zabbix-proxy ~]# curl -X POST -H "Content-Type: application/json-rpc" -d '
> {
> "jsonrpc": "2.0",
>     "method": "host.create",
>     "params": {
>         "host": "Young Server",
>         "interfaces": [
>             {
>                 "type": 1,
>                 "main": 1,
>                 "useip": 1,
>                 "ip": "10.0.0.252",
>                 "dns": "",
>                 "port": "10050"
>             }
>         ],
>         "groups": [
>             {
>                 "groupid": "2"
>             }
>         ],
>         "templates": [
>             {
>                 "templateid": "10312"
>             },
>             {
>                 "templateid": "10001"
>             }
>         ]
>     },
>     "auth": "a37a7487df02c28e45e7f598291a6aea",
>     "id": 1
> }' http://10.0.0.251/zabbix/api_jsonrpc.php
{"jsonrpc":"2.0","result":{"hostids":["10325"]},"id":1}[root@zabbix-proxy ~]# 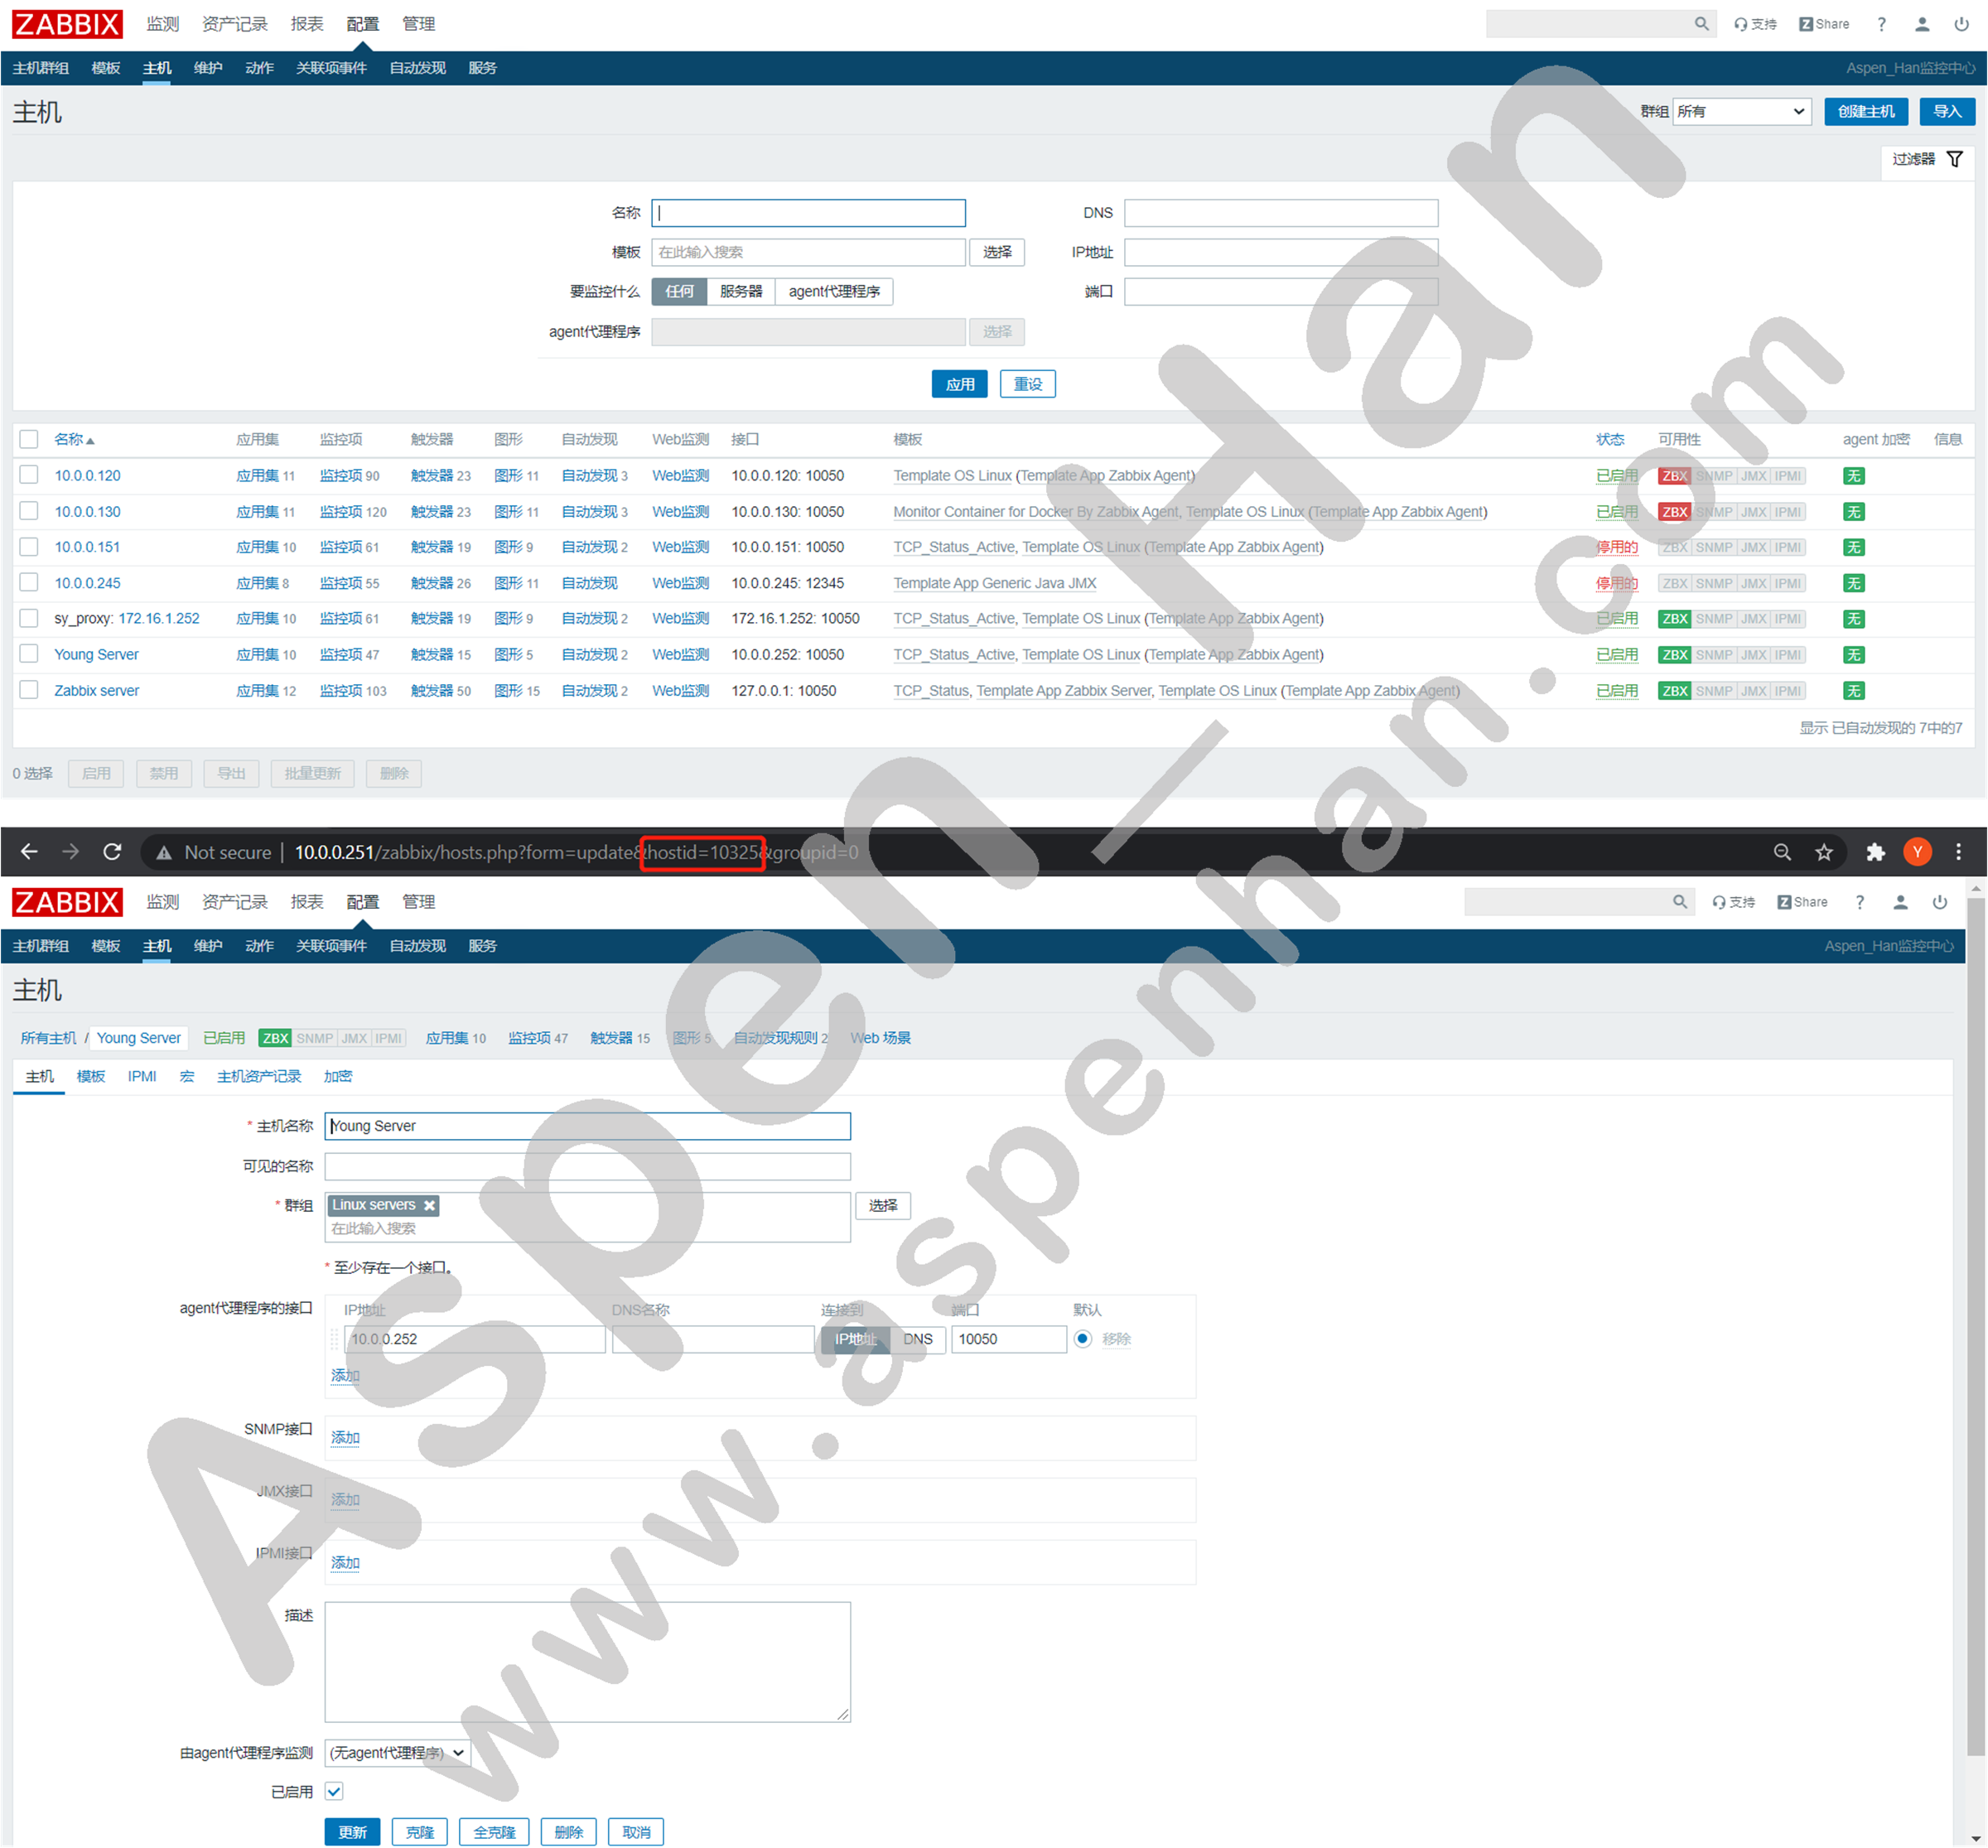
- 删除主机
|
curl -X POST -H "Content-Type: application/json-rpc" -d ' {
"jsonrpc": "2.0",
"method": "host.delete", #声明删除主机
"params": [
"主机ID" #指定删除主机ID
],
"auth": "授权码", #指定zabbix授权码
"id": 1
}' https://IP地址/zabbix/api_jsonrpc.php |
[root@zabbix-proxy ~]# curl -X POST -H "Content-Type: application/json-rpc" -d '
> {
> "jsonrpc": "2.0",
> "method": "host.delete",
> "params": [
> "10325"
>     ],
> "auth": "a37a7487df02c28e45e7f598291a6aea",
> "id": 1
> }' http://10.0.0.251/zabbix/api_jsonrpc.php
{"jsonrpc":"2.0","result":{"hostids":["10325"]},"id":1}[root@zabbix-proxy ~]#