一、elk概述
1.简介
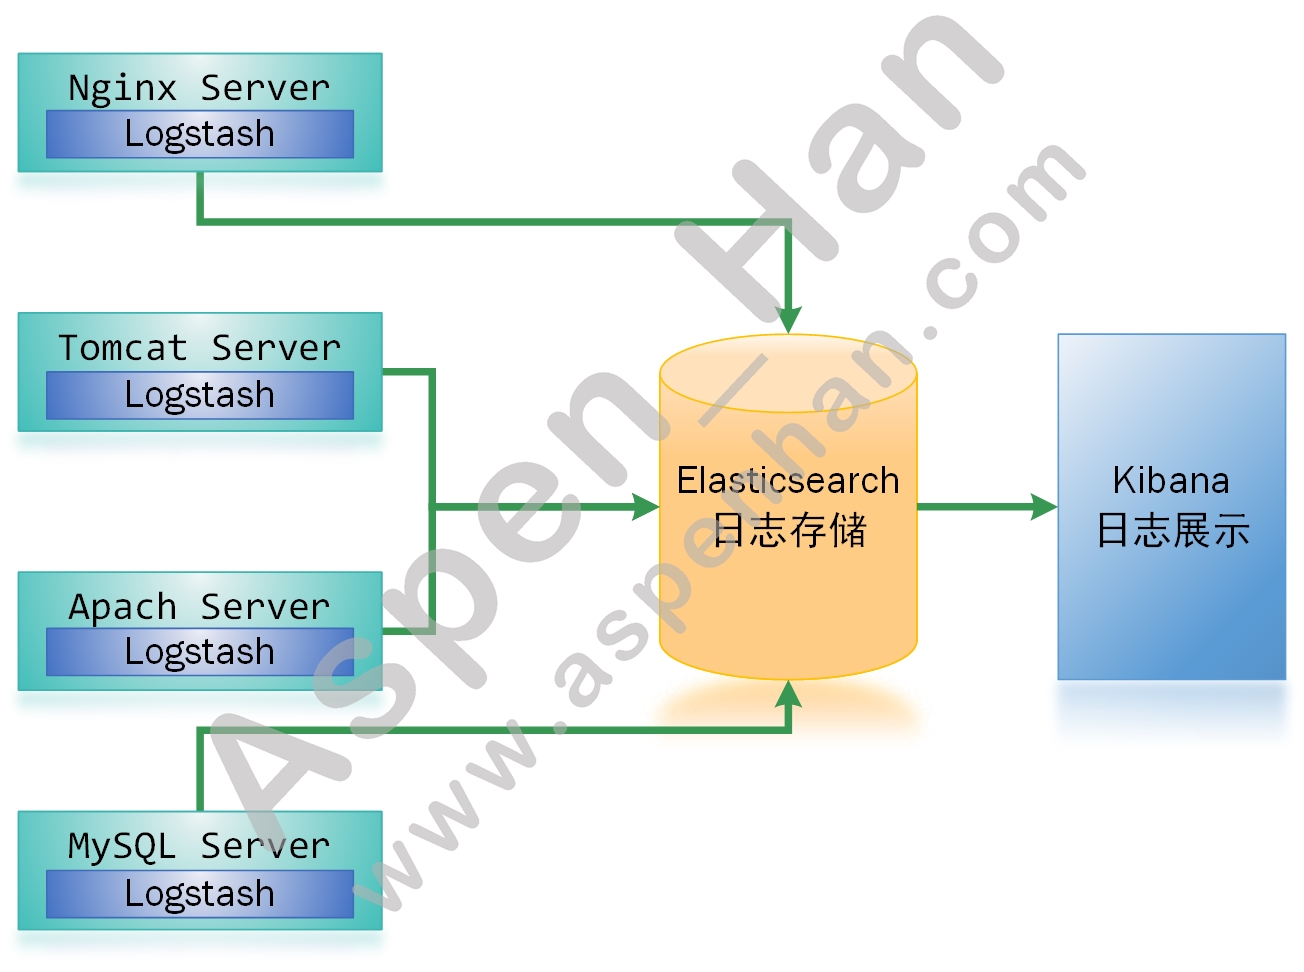
ELK是一套软件的组合,它由三部分组成,分别是elasticsearch,logstash和kinbana
2.elasticsearch
ElasticSearch是基于Lucene,并经过java进行二次封装的搜索服务,它提供了一个分布式多用户能力的全文搜索引擎。
功能:数据存储、数据搜索、数据分析
二、ElasticSearch
1.安装
step1 安装Java软件包
| yum install -y java-1.8.0-openjdk |
[root@es01 /tmp]# yum install -y java-1.8.0-openjdk
Loaded plugins: fastestmirror
Determining fastest mirrors
 * base: mirrors.aliyun.com
 * extras: mirrors.aliyun.com
 * updates: mirrors.aliyun.com
......
  xorg-x11-font-utils.x86_64 1:7.5-21.el7
  xorg-x11-fonts-Type1.noarch 0:7.5-9.el7
Complete!

[root@es01 /tmp]# java -version
openjdk version "1.8.0_232"
OpenJDK Runtime Environment (build 1.8.0_232-b09)
OpenJDK 64-Bit Server VM (build 25.232-b09, mixed mode)
step2 安装Elasticsearch
| yum localinstall 安装包 -y |
[root@es01 /tmp]# yum localinstall -y elasticsearch-7.4.1-x86_64.rpm
Loaded plugins: fastestmirror
......
Installed:
  elasticsearch.x86_64 0:7.4.1-1

Complete!

[root@es01 /tmp]# rpm -qa elasticsearch
elasticsearch-7.4.1-1.x86_64
step3 编辑配置文件
|
vim /etc/elasticsearch/elasticsearch.yml cluster.name: 集群名称 #同一集群各节点集群名称相同 node.name: 节点名称 #同一集群下不同节点名称不能相同 path.data: 数据存放目录 #目录属主和属组必须为elasticsearch path.logs: 日志存放目录 #目录属主和属组必须为elasticsearch network.host: 本节点IP地址(侦听) http.port: 端口号 #默认开启,elasticsearch默认启动2个端口9200和9300 discovery.zen.ping.unicast.hosts: ["节点IP地址","节点IP地址"] http.cors.enabled: true http.cors.allow-origin: "*" |
[root@es01 /tmp]# id elasticsearch
uid=998(elasticsearch) gid=996(elasticsearch) groups=996(elasticsearch)
[root@es01 /tmp]# egrep -v "^$|^#" /etc/elasticsearch/elasticsearch.yml
cluster.name: ES_cluster
node.name: es01
path.data: /data/elasticsearch/data/
path.logs: /data/elasticsearch/logs/
network.host: 10.0.0.241
http.port: 9200
discovery.seed_hosts: ["10.0.0.241", "10.0.0.242", "10.0.0.243"]
cluster.initial_master_nodes: ["es01", "es02"]
http.cors.enabled: true
http.cors.allow-origin: "*"
[root@es01 /tmp]# mkdir -p /data/elasticsearch/{data,logs}
[root@es01 /tmp]# chown -R elasticsearch. /data/elasticsearch/
[root@es01 /tmp]# ll /data/elasticsearch/
total 0
drwxr-xr-x 2 elasticsearch elasticsearch 6 Nov 24 14:26 data
drwxr-xr-x 2 elasticsearch elasticsearch 6 Nov 24 14:26 logs
[root@es02 /tmp]# id elasticsearch
uid=998(elasticsearch) gid=996(elasticsearch) groups=996(elasticsearch)
[root@es02 /tmp]# egrep -v '^#|^$' /etc/elasticsearch/elasticsearch.yml
cluster.name: ES_cluster
node.name: es02
path.data: /data/elasticsearch/data/
path.logs: /data/elasticsearch/logs/
network.host: 10.0.0.242
http.port: 9200
discovery.seed_hosts: ["10.0.0.241", "10.0.0.242"]
cluster.initial_master_nodes: ["es01", "es02"]
http.cors.enabled: true
http.cors.allow-origin: "*"
[root@es02 /tmp]# mkdir -p /data/elasticsearch/{data,logs}
[root@es02 /tmp]# chown -R elasticsearch. /data/elasticsearch/
[root@es02 /tmp]# ll /data/elasticsearch/
total 0
drwxr-xr-x 2 elasticsearch elasticsearch 6 Nov 24 14:33 data
drwxr-xr-x 2 elasticsearch elasticsearch 6 Nov 24 14:33 logs[root@es03 /tmp]# id elasticsearch
uid=998(elasticsearch) gid=996(elasticsearch) groups=996(elasticsearch)
[root@es03 /tmp]# egrep -v '^#|^$' /etc/elasticsearch/elasticsearch.yml
cluster.name: ES_cluster
node.name: es03
path.data: /data/elasticsearch/data/
path.logs: /data/elasticsearch/logs/
network.host: 10.0.0.243
http.port: 9200
discovery.seed_hosts: ["10.0.0.241", "10.0.0.243"]
cluster.initial_master_nodes: ["es01", "es02"]
http.cors.enabled: true
http.cors.allow-origin: "*"
[root@es03 /tmp]# mkdir /data/elasticsearch/{data,logs} -p
[root@es03 /tmp]# chown -R elasticsearch. /data/elasticsearch/
[root@es03 /tmp]# ll /data/elasticsearch/
total 0
drwxr-xr-x 2 elasticsearch elasticsearch 6 Nov 24 14:40 data
drwxr-xr-x 2 elasticsearch elasticsearch 6 Nov 24 14:40 logsstep4 启动elasticsearch
| systemctl start elasticsearch |
[root@es01 /tmp]# systemctl start elasticsearch.service [root@es02 /tmp]# systemctl start elasticsearch.service [root@es03 /tmp]# systemctl start elasticsearch.service step5 查看日志
| tail -f /日志路径/集群名.log |
[root@es01 /tmp]# tail -2 /data/elasticsearch/logs/ES_cluster.log
[2019-11-24T14:42:54,434][INFO ][o.e.x.m.e.l.LocalExporter] [es01] waiting for elected master node [{es02}{Z8DbiOpDT32MPAkK_tFgvg}{kM2WoYw_QCem5_OdDtPEfQ}{10.0.0.242}{10.0.0.242:9300}{dilm}{ml.machine_memory=2076762112, ml.max_open_jobs=20, xpack.installed=true}] to setup local exporter [default_local] (does it have x-pack installed?)
[2019-11-24T14:45:38,003][INFO ][o.e.c.s.ClusterApplierService] [es01] added {{es03}{4U8ccNjVQPSG9BNuTAHtsQ}{J86YGSgkRdGix1nXDa94qg}{10.0.0.243}{10.0.0.243:9300}{dilm}{ml.machine_memory=2076762112, ml.max_open_jobs=20, xpack.installed=true},}, term: 1, version: 19, reason: ApplyCommitRequest{term=1, version=19, sourceNode={es02}{Z8DbiOpDT32MPAkK_tFgvg}{kM2WoYw_QCem5_OdDtPEfQ}{10.0.0.242}{10.0.0.242:9300}{dilm}{ml.machine_memory=2076762112, ml.max_open_jobs=20, xpack.installed=true}}
step6 查看节点及集群状态
|
curl 节点IP地址:端口号 #查看节点状态 curl 节点IP地址:端口号/_cluster/health?pretty #查看节点所在集群状态 |
[root@es01 /opt/elasticsearch-head]# curl 10.0.0.241:9200
{
"name" : "es01",
"cluster_name" : "ES_cluster",
"cluster_uuid" : "JsyMBrTlTTmYx9WoQlO-fw",
"version" : {
"number" : "7.4.1",
"build_flavor" : "default",
"build_type" : "rpm",
"build_hash" : "fc0eeb6e2c25915d63d871d344e3d0b45ea0ea1e",
"build_date" : "2019-10-22T17:16:35.176724Z",
"build_snapshot" : false,
"lucene_version" : "8.2.0",
"minimum_wire_compatibility_version" : "6.8.0",
"minimum_index_compatibility_version" : "6.0.0-beta1"
},
"tagline" : "You Know, for Search"
}
[root@es01 /opt/elasticsearch-head]# curl 10.0.0.241:9200/_cluster/health?pretty
{
"cluster_name" : "ES_cluster",
"status" : "green",
"timed_out" : false,
"number_of_nodes" : 3,
"number_of_data_nodes" : 3,
"active_primary_shards" : 0,
"active_shards" : 0,
"relocating_shards" : 0,
"initializing_shards" : 0,
"unassigned_shards" : 0,
"delayed_unassigned_shards" : 0,
"number_of_pending_tasks" : 0,
"number_of_in_flight_fetch" : 0,
"task_max_waiting_in_queue_millis" : 0,
"active_shards_percent_as_number" : 100.0
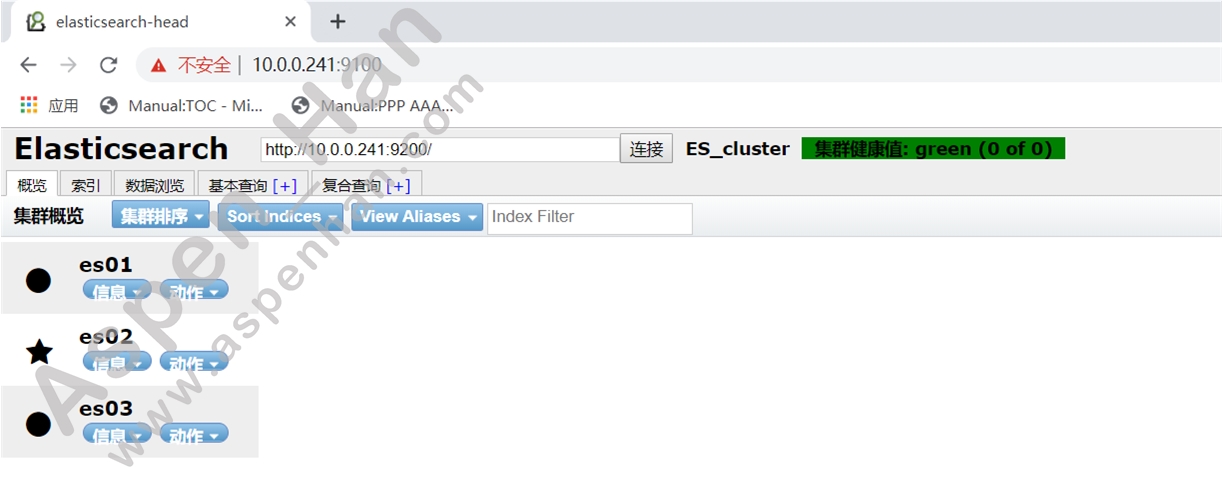
}2.HEAD插件安装
step1 配置epel源
配置方法详见基于Cent OS 7的Linux系统基础优化
step2 安装依赖软件
| yum install -y nodejs npm openssl screen |
[root@es01 /tmp]# yum install -y nodejs npm openssl screen
......
Installed:
  nodejs.x86_64 1:6.17.1-1.el7
  npm.x86_64 1:3.10.10-1.6.17.1.1.el7
  screen.x86_64 0:4.1.0-0.25.20120314git3c2946.el7

Dependency Installed:
  libuv.x86_64 1:1.33.0-2.el7

Updated:
  openssl.x86_64 1:1.0.2k-19.el7

Dependency Updated:
  openssl-libs.x86_64 1:1.0.2k-19.el7

Complete!
step3 查看依赖包版本信息
| node -v npm -v |
[root@es01 /tmp]# node -v
v6.17.1
[root@es01 /tmp]# npm -v
3.10.10
step4 安装cnpm
| npm install -g cnpm --registry=https://registry.npm.taobao.org |
[root@es01 /tmp]# npm install -g cnpm -- registry=https://registry.npm.taobao.org
/usr/bin/cnpm -> /usr/lib/node_modules/cnpm/bin/cnpm
/usr/lib
......
    │   └── wrappy@1.0.2
    ├── qs@6.9.1
    └── statuses@1.5.0
step5 安装git工具,并把elasticsearch-head相关文件克隆到本地
| yum install -y git git clone git://github.com/mobz/elasticsearch-head.git cd elasticsearch-head/ cnpm install |
[root@es01 /tmp]# yum install -y git
[root@es01 /tmp]# cd /opt
[root@es01 /opt]# git clone git://github.com/mobz/elasticsearch-head.git
Cloning into 'elasticsearch-head'...
remote: Enumerating objects: 77, done.
remote: Counting objects: 100% (77/77), done.
remote: Compressing objects: 100% (57/57), done.
remote: Total 4337 (delta 38), reused 45 (delta 17), pack-reused 4260
Receiving objects: 100% (4337/4337), 2.51 MiB | 22.00 KiB/s, done.
Resolving deltas: 100% (2411/2411), done.
[root@es01 /opt]# cd elasticsearch-head/
[root@es01 /opt/elasticsearch-head]# cnpm install
......
✔ All packages installed (449 packages installed from npm registry, used 16s(network 6s), speed 1.2MB/s, json 375(703.99kB), tarball 6.88MB)
step6 启动cnpm
|
screen -S es-head #切屏 cnpm run start #一定要在elasticsearch-head目录下执行 Ctrl+A+D #屏幕切回(相当于把cnpm置于后台运行) |
[root@es01 /opt/elasticsearch-head]# screen  -S es-head
[root@es01 /opt/elasticsearch-head]# cnpm run start

> elasticsearch-head@0.0.0 start /opt/elasticsearch-head
> grunt server

Running "connect:server" (connect) task
Waiting forever...
Started connect web server on http://localhost:9100
[detached from 11086.es-head]
[root@es01 /opt/elasticsearch-head]# ss -lnt
State      Recv-Q Send-Q       Local Address:Port                      Peer Address:Port
LISTEN     0      128                      *:9100                                 *:*
LISTEN     0      128                      *:22                                   *:*
LISTEN     0      100              127.0.0.1:25                                   *:*
LISTEN     0      128      ::ffff:10.0.0.241:9200                                :::*
LISTEN     0      128      ::ffff:10.0.0.241:9300                                :::*
LISTEN     0      128                     :::22                                  :::*
LISTEN 0 100 ::1:25 |
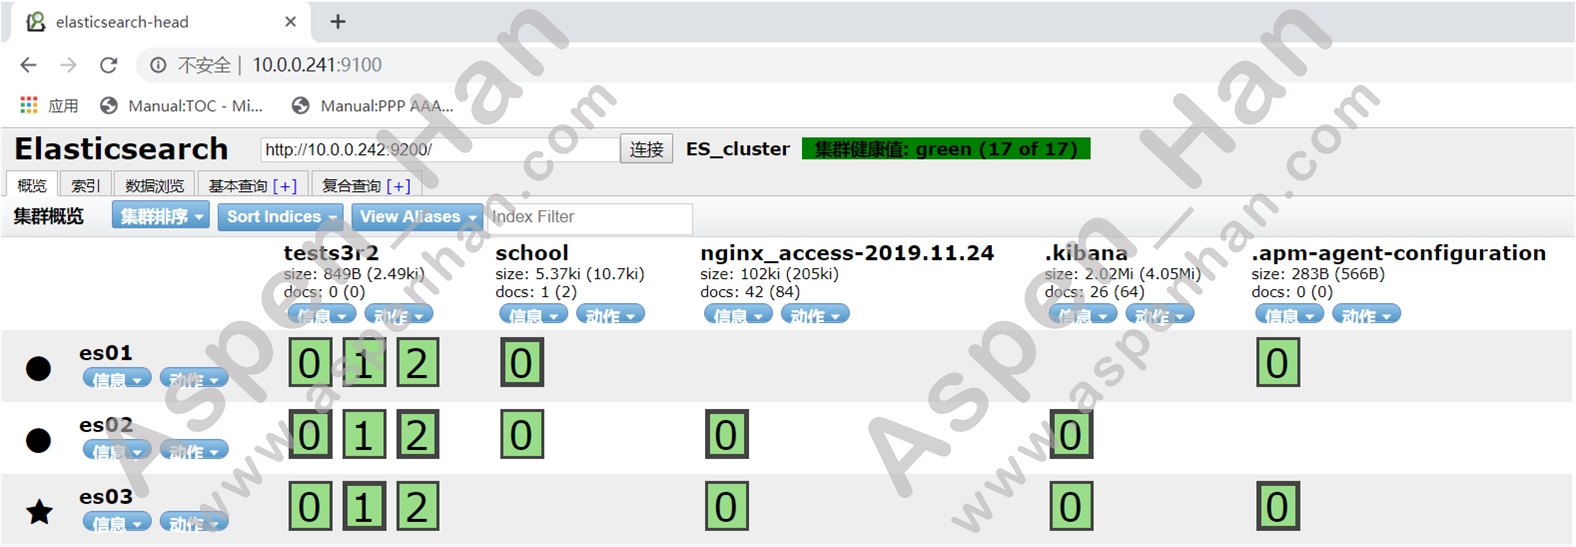
集群健康状态 绿色:集群状态健康 黄色:亚健康状态,节点或集群仍处于运行状态 红色:危险,数据可能已经丢失 |
3.elasticsearch数据库基本操作
| elasticsearch | mysql |
|---|---|
| 索引(index) | 数据库(Database) |
| 类型(type) | 表(Table) |
| id号(id) | 字段(segment) |
插入数据
|
curl -XPUT '主机IP:端口/数据库名/表名/id?pretty' -H 'Content-Type:application/json' -d'
{
数据内容
}' |
[root@esweb /tmp]# curl -XPUT '10.0.0.241:9200/school/student/1?pretty' -H 'Content-Type:application/json' -d'
> {
> "name" : "Li si",
> "age" : "28",
> "about" : "I love cat",
> "Interests" : ["swim"]
> }
> '
{
  "_index" : "school",
  "_type" : "student",
  "_id" : "1",
  "_version" : 1,
  "result" : "created",
  "_shards" : {
    "total" : 2,
    "successful" : 1,
    "failed" : 0
  },
  "_seq_no" : 0,
  "_primary_term" : 1
}
查询数据
| curl -XGET '主机IP:端口/数据库名/表名/id?pretty' |
[root@esweb /tmp]# curl -XGET '10.0.0.241:9200/school/student/1?pretty'
{
  "_index" : "school",
  "_type" : "student",
  "_id" : "1",
  "_version" : 1,
  "_seq_no" : 0,
  "_primary_term" : 1,
  "found" : true,
  "_source" : {
    "name" : "Li si",
    "age" : "28",
    "about" : "I love cat",
    "Interests" : [
      "swim"
    ]
  }
}
删除数据
| curl -XDELETE '主机IP:端口/数据库名/表名/id?pretty' |
[root@esweb /tmp]# curl -XDELETE '10.0.0.241:9200/school/student/1?pretty'
{
  "_index" : "school",
  "_type" : "student",
  "_id" : "1",
  "_version" : 2,
  "result" : "deleted",
  "_shards" : {
    "total" : 2,
    "successful" : 2,
    "failed" : 0
  },
  "_seq_no" : 2,
  "_primary_term" : 1
}
创建索引
| curl -XPUT '主机IP:端口/数据库名?pretty' |
[root@esweb /tmp]# curl  -XPUT '10.0.0.241:9200/company?pretty'
{
  "acknowledged" : true,
  "shards_acknowledged" : true,
  "index" : "company"
}| 注:索引一旦建立,索引的分片数(默认5分片-6.4.1版本)和副本数量就无法更改 |
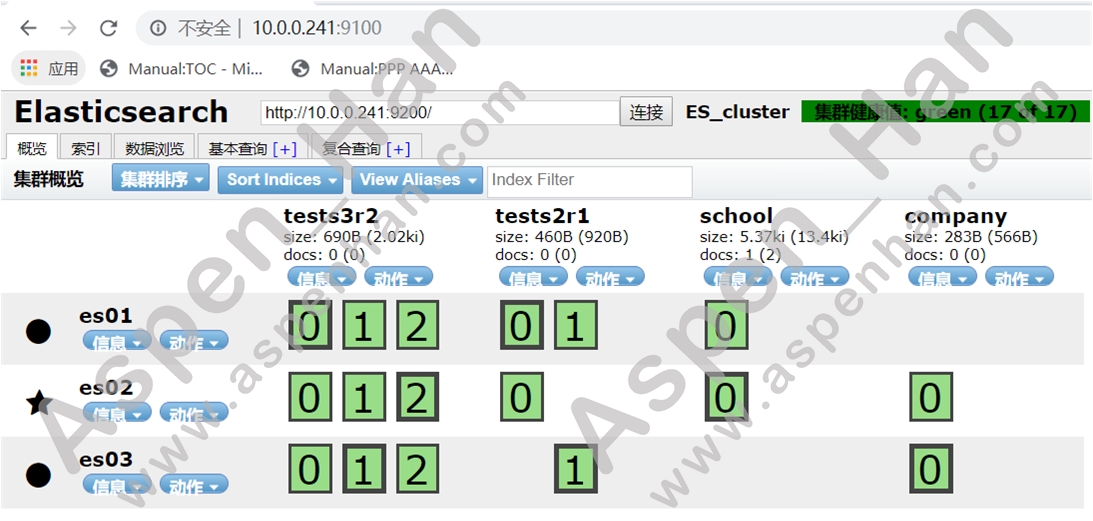
创建索引并指定分片和副本数量
|
curl -XPUT '主机IP:端口/数据库名?pretty' -H 'Content-Type:application/json' -d '{ "settings":{ "number_of_shards" : n, #分片数
"number_of_replicas" : n #副本数
}
}' |
[root@esweb /tmp]# curl  -XPUT '10.0.0.241:9200/tests3r2?pretty' -H 'Content-Type:application/json' -d '
{
"settings" :{
"number_of_shards" : 3,
"number_of_replicas" : 2
}
}
'
{
  "acknowledged" : true,
  "shards_acknowledged" : true,
  "index" : "tests3r2"
}
[root@esweb /tmp]# curl  -XPUT '10.0.0.241:9200/tests2r1?pretty' -H 'Content-Type:application/json' -d '
{
"settings" :{
"number_of_shards" : 2,
"number_of_replicas" : 1
}
}
'
{
  "acknowledged" : true,
  "shards_acknowledged" : true,
  "index" : "tests2r1"
}
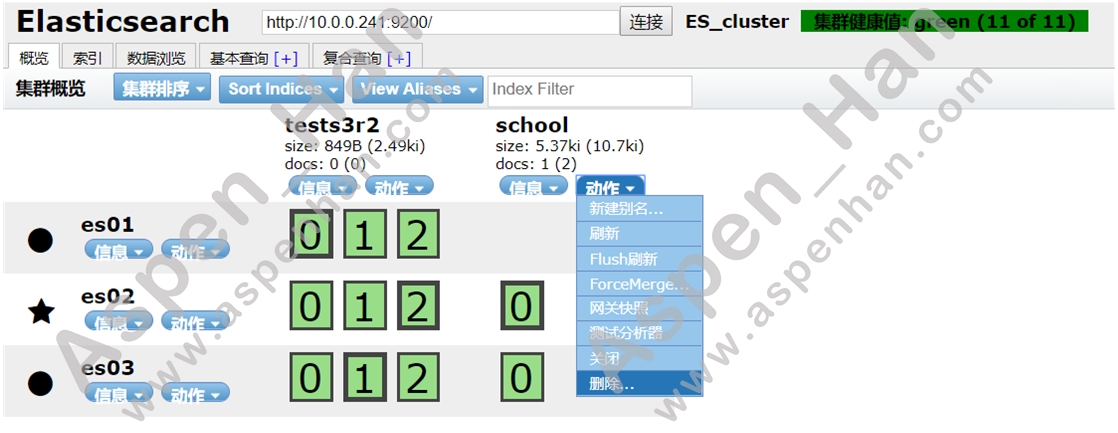
删除索引
| curl -XDELETE '主机IP:端口/数据库名?pretty' |
[root@esweb /tmp]# curl  -XDELETE '10.0.0.241:9200/tests2r1?pretty'
{
  "acknowledged" : true
}
4.更改Elasticsearch默认的分片与副本数量
step 1 停止logstash
[root@esweb ~]# systemctl stop logstash.service step 2 删除指定的索引
step 3 修改模版默认分片与副本数量
[root@es01 ~]# curl -XPUT '10.0.0.241:9200/_template/template_http_request_record' -H 'Content-Type: application/json' -d' {
> "index_patterns": ["*"],
> "settings": {
> "number_of_shards" : 4,
> "number_of_replicas" : 1
> }
> }
> '
{"acknowledged":true}
step 4 重启elasticsearch
[root@es01 ~]# systemctl restart elasticsearch.service [root@es02 ~]# systemctl restart elasticsearch.service[root@es03 ~]# systemctl restart elasticsearch.servicestep 5 启动logstash
[root@esweb ~]# systemctl start logstash.service
[root@esweb ~]# ss -lnt
State      Recv-Q Send-Q       Local Address:Port                      Peer Address:Port
LISTEN     0      128                      *:80                                   *:*
LISTEN     0      128                      *:22                                   *:*
LISTEN     0      100              127.0.0.1:25                                   *:*
LISTEN     0      128                     :::22                                  :::*
LISTEN     0      100                    ::1:25                                  :::*
LISTEN     0      50       ::ffff:10.0.0.244:9600                                :::*
step 6 验证

三、Kibana与Logstash
1.kibana安装
step1 安装kibana
| yum localinstall -y 安装包名称 |
[root@es01 /tmp]# yum localinstall -y kibana-7.4.1-x86_64.rpm
......
Installed:
  kibana.x86_64 0:7.4.1-1

Complete!
step2 修改配置文件
|
vim /etc/kibana/kibana.yml server.port: 端口 #指定服务端口(默认端口:5061) server.host: IP地址 #指定监听地址 elasticsearch.url: "http://IP地址:端口" #指定日志来源 |
[root@es01 ~]# egrep -v '^$|^#' /etc/kibana/kibana.yml
server.port: 5601
server.host: "10.0.0.241"
elasticsearch.hosts: ["http://10.0.0.241:9200"]
i18n.locale: zh_CN
step3 启动kibana
| systemctl start kibana |
[root@es01 /tmp]# systemctl start kibana
[root@es01 /tmp]# systemctl status kibana
● kibana.service - Kibana
   Loaded: loaded (/etc/systemd/system/kibana.service; disabled; vendor preset: disabled)
   Active: active (running) since Sun 2019-11-24 17:35:56 CST; 5s ago
 Main PID: 11445 (node)
   CGroup: /system.slice/kibana.service
           └─11445 /usr/share/kibana/bin/../node/bin/node /us...

Nov 24 17:35:56 es01 systemd[1]: Started Kibana.
2.logstash安装
step0 安装软件依赖Java
| yum install -y java-1.8.0-openjdk |
[root@esweb /tmp]# yum install -y java-1.8.0-openjdk
......
  xorg-x11-font-utils.x86_64 1:7.5-21.el7
  xorg-x11-fonts-Type1.noarch 0:7.5-9.el7

Complete!
step1 安装logstatsh
| yum localinstall -y logstash |
[root@esweb /tmp]# yum localinstall -y logstash-7.4.1.rpm
......
Installed:
  logstash.noarch 1:7.4.1-1

Complete!
step2 修改配置文件
|
vim /etc/logstash/logstash.yml path.data: 路径 #指定服务数据存放路径(默认:/var/lib/logstash) http.host: "IP地址" #指定监听地址 http.port: 端口 #指定服务端口(默认端口:9600) path.logs: 路径 #指定服务日志存放路径(默认:/var/log/logstash) |
[root@esweb /tmp]# egrep -v '^$|^#' /etc/logstash/logstash.yml
path.data: /data/logstash/data
http.host: "10.0.0.244"
http.port: 9600
path.logs: /data/logstash/logs
[root@esweb /tmp]# id logstash
uid=998(logstash) gid=996(logstash) groups=996(logstash)
[root@esweb /tmp]# mkdir -p /data/logstash/{data,logs}
[root@esweb /tmp]# chown -R logstash. /data/logstash/
[root@esweb /tmp]# ll /data/logstash/
total 0
drwxr-xr-x 2 logstash logstash 6 Nov 24 16:57 data
drwxr-xr-x 2 logstash logstash 6 Nov 24 16:57 logs
step3 指定日志来源
|
vim /etc/logstash/conf.d/文件名.conf input{ file {
path =>"日志来源"
start_position => "end"
type => "日志类型"
codec => json #指定日志格式类型
}
} elasticsearch {
hosts => ["日志服务器IP地址:端口号"]
index => "日志存储库名称"
}
} |
[root@esweb /data/logstash/logs]# vim /etc/logstash/conf.d/nginx_access.conf
input {
    file {
        path => "/var/log/nginx/nginx_json.log"
        start_position => "end"
        type => "nginx_access"
        codec => json
    }
}
output {
    elasticsearch {
        hosts => ["10.0.0.241:9200"]
        index => "nginx_access-%{+YYYY.MM.dd}"
    }
}
step4 启动logstash
| systemctl start logstash |
[root@esweb ~]# systemctl start logstash
[root@esweb ~]# systemctl status logstash.service
● logstash.service - logstash
   Loaded: loaded (/etc/systemd/system/logstash.service; disabled; vendor preset: disabled)
   Active: active (running) since Sun 2019-11-24 17:22:50 CST; 1min 19s ago
 Main PID: 8876 (java)
   CGroup: /system.slice/logstash.service
           └─8876 /bin/java -Xms1g -Xmx1g -XX:+UseConcMarkSweepGC -XX:CMSInitiatingOccupancyFraction=...

Nov 24 17:22:50 esweb systemd[1]: Started logstash.
Nov 24 17:22:52 esweb logstash[8876]: OpenJDK 64-Bit Server VM warning: If the number of processo...ds=N
Hint: Some lines were ellipsized, use -l to show in full.
3.结合Nginx实现ELK
step0 安装Nginx Web服务
安装步骤详见基于nginx服务的Web应用
step1 修改nginx主配置文件,变更日志记录格式
|
vim /etc/nginx/nginx.conf
log_format access_json '{"@timestamp":"$time_iso8601",'
'"host":"$server_addr",'
'"clientip":"$remote_addr",'
'"size":$body_bytes_sent,'
'"responsetime":$request_time,'
'"upstreamtime":"$upstream_response_time",'
'"upstreamhost":"$upstream_addr",'
'"http_host":"$host",'
'"url":"$uri",'
'"domain":"$host",'
'"xff":"$http_x_forwarded_for",'
'"referer":"$http_referer",'
'"status":"$status"}';
access_log /var/log/nginx/access_json.log access_json;
|
[root@esweb ~]# awk 'NR>=14&&NR<=27' /etc/nginx/nginx.conf
log_format access_json '{"@timestamp":"$time_iso8601",'
'"host":"$server_addr",'
'"clientip":"$remote_addr",'
'"size":$body_bytes_sent,'
'"responsetime":$request_time,'
'"upstreamtime":"$upstream_response_time",'
'"upstreamhost":"$upstream_addr",'
'"http_host":"$host",'
'"url":"$uri",'
'"domain":"$host",'
'"xff":"$http_x_forwarded_for",'
'"referer":"$http_referer",'
'"status":"$status"}';
access_log /var/log/nginx/nginx_json.log access_json;
[root@esweb ~]# nginx -t
nginx: the configuration file /etc/nginx/nginx.conf syntax is ok
nginx: configuration file /etc/nginx/nginx.conf test is successful
[root@esweb ~]# systemctl restart nginx
[root@esweb ~]# ll /var/log/nginx/nginx_json.log
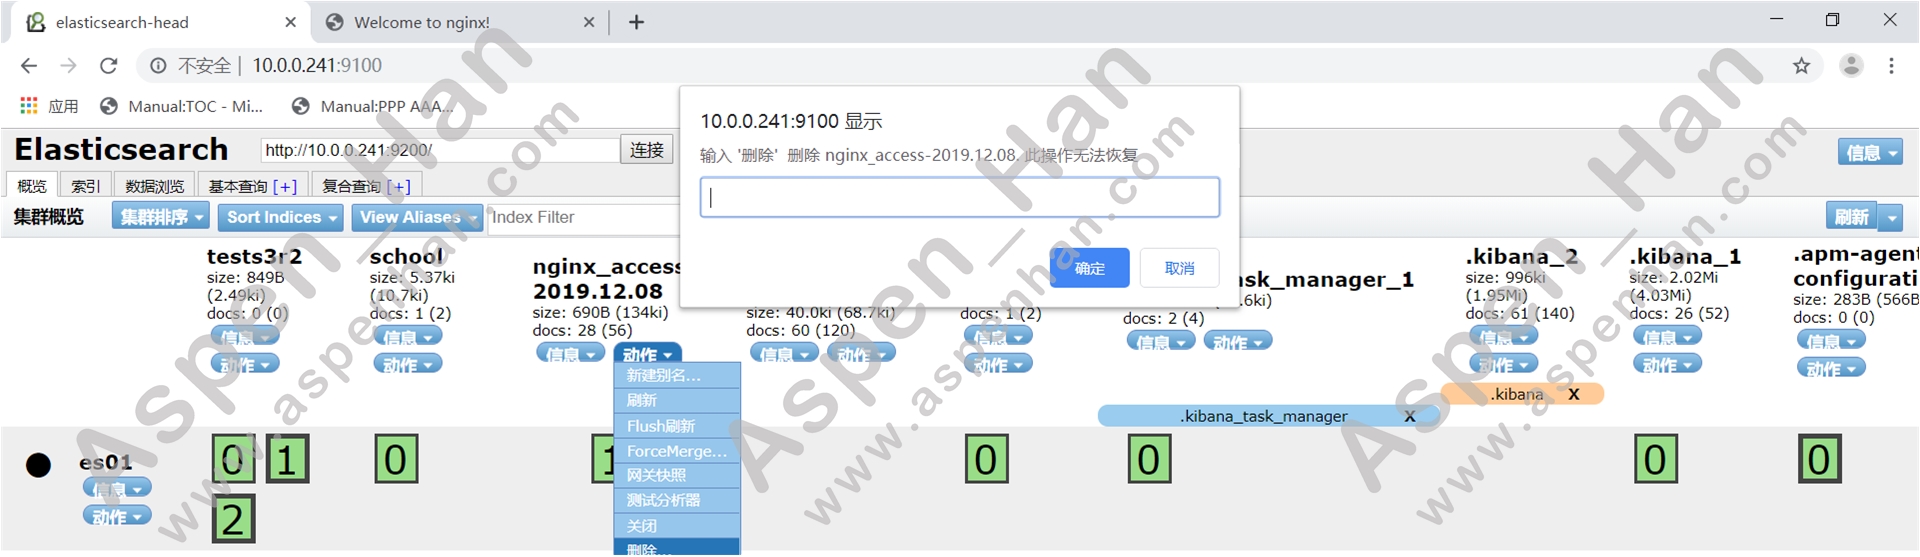
-rw-r--r-- 1 root root 0 Nov 24 17:26 /var/log/nginx/nginx_json.logstep1 查看elasticsearch head插件
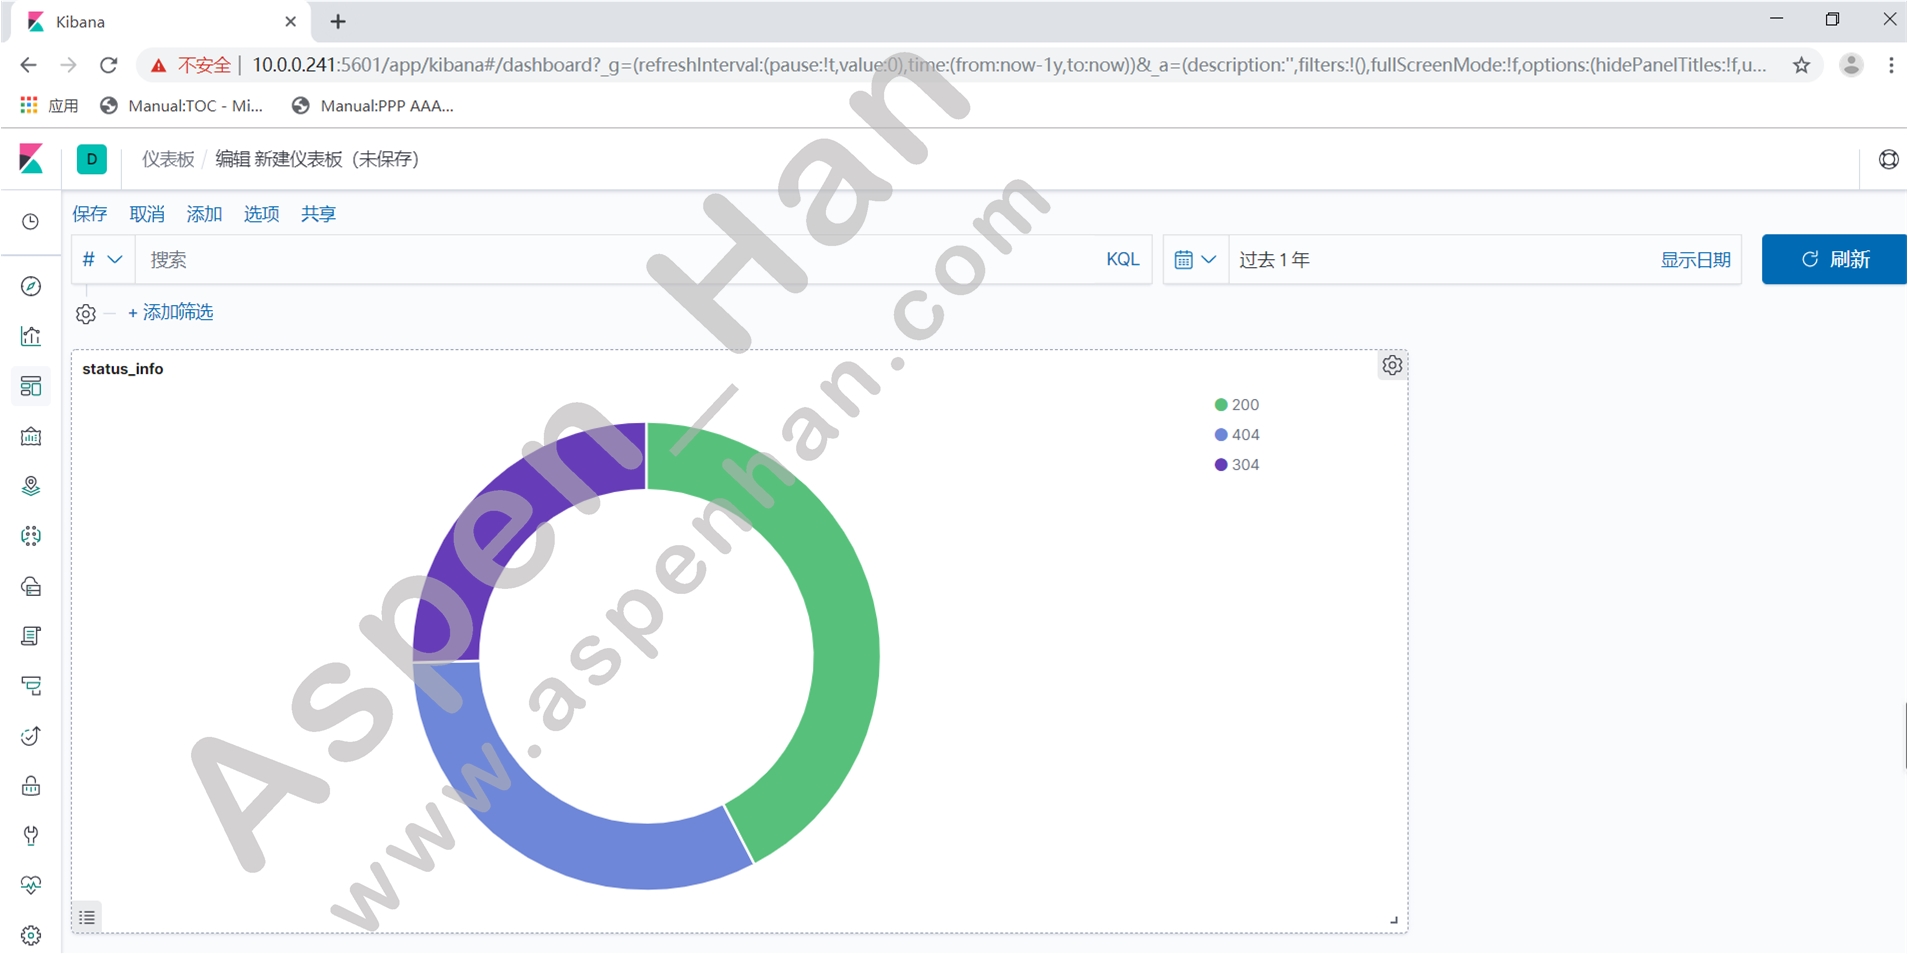
step2 Kibana->Management->Index Patterns
三、基于Redis缓存的EFK架构
1.架构概述

该架构业务节点应关闭logstash,filebeat是一款轻量级的日志搜集工具
2.安装filebeat
step1 安装filebeat
| yum localinstall -y 安装包 |
[root@esweb /tmp]# yum localinstall -y filebeat-7.4.1-x86_64.rpm
......
Installed:
  filebeat.x86_64 0:7.4.1-1

Complete!
step2 编辑配置文件
|
vim /etc/filebeat/filebeat.yml filebeat.inputs: - type: log enabled: true
paths:
- 源日志路径
filebeat.config.modules: path: ${path.config}/modules.d/*.yml
reload.enabled:false
output.redis: hosts: ["Redis主机地址"]
port: 端口 #默认端口6379
key: "日志类型"
db: 数据库ID' #默认是0-15
timeout: 超时时间(单位秒)'
|
[root@esweb /var/log/nginx]# grep -Ev '^$|#' /etc/filebeat/filebeat.yml
filebeat.inputs:
- type: log
  enabled: true
  paths:
    - /var/log/nginx/nginx_json.log
filebeat.config.modules:
  path: ${path.config}/modules.d/*.yml
  reload.enabled: false
output.redis:
  hosts: ["10.0.0.241:6379"]
  key: "nginx_json_log"
  db: 0
  timeout: 5
processors:
  - add_host_metadata: ~
  - add_cloud_metadata: ~
step3 启动filebeat
| systemctl start filebeat |
[root@esweb /etc/filebeat]# systemctl start filebeat
[root@esweb /etc/filebeat]# ps -ef | grep filebeat
root      12461      1  0 17:36 ?        00:00:00 /usr/share/filebeat/bin/filebeat -e -c /etc/filebeat/filebeat.yml -path.home /usr/share/filebeat -path.config /etc/filebeat -path.data /var/lib/filebeat -path.logs /var/log/filebeat
root      12490  11323  0 17:40 pts/1    00:00:00 grep --color=auto filebeat
当filebeat启动失败时,可以采用手动启动的方式,查看错误提示;yum安装的filebeat可使用下面个的命令
| /usr/share/filebeat/bin/filebeat -c /etc/filebeat/filebeat.yml -path.home /usr/share/filebeat -path.config /etc/filebeat -path.data /var/lib/filebeat -path.logs /var/log/filebeat |
3.安装redis
step1 安装redis
| yum install -y redis |
 [root@es01 ~]# yum install -y redis
 ......
Installed:
  redis.x86_64 0:3.2.12-2.el7

Dependency Installed:
  jemalloc.x86_64 0:3.6.0-1.el7

Complete!
step2 修改配置文件
|
vim /etc/redis.conf bind 监听地址 protected-mode yes port 端口 #默认端口是6379 tcp-backlog 511 timeout 0 #永不超时 tcp-keepalive 300 daemonize yes #开启守护进程模式 supervised no pidfile /var/run/redis_6379.pid loglevel notice logfile 日志路径 #默认路径为/var/log/redis/redis.log datebases 数据库数量 #默认16 save 900 1 save 300 10 save 60 10000 stop-writes-on-bgsave-error yes rbdcompression yes rdbchecksum yes dbfilename dump.rdb dir /var/lib/redis slave-serve-stable-data yes slave-read-only yes repl-diskless-sync no repl-diskless-sync-delay 5 repl-disable-tcp-nodelay no slave-priority 100 |
[root@es01 /data/redis/conf]# cat /data/redis/conf/redis.conf
daemonize yes
bind 10.0.0.241 127.0.0.1
port 6379
protected-mode yes
dir /data/redis/data
pidfile /data/redis/conf/redis.pid
loglevel notice
logfile /data/redis/logs/redis.log
dbfilename dump.rdb
save 900 1
save 300 10
save 60 10000
step3 启动redis
| systemctl start redis |
[root@es01 /data/redis/conf]# redis-server /data/redis/conf/redis.conf &
[1] 13969
[root@es01 /data/redis/conf]#
[1]+  Done                    redis-server /data/redis/conf/redis.conf
[root@es01 /data/redis/conf]# redis-cli --version
redis-cli 3.2.12
4.redis基本操作
连接数据库
| redis-cli -h 主机IP |
[root@es01 /data/redis/conf]# redis-cli -h 10.0.0.241
10.0.0.241:6379>
查询所有数据库
| keys * |
10.0.0.241:6379> keys *
1) "nginx_json_log"
查询redis信息
| info |
10.0.0.241:6379> info
# Server
redis_version:3.2.12
redis_git_sha1:00000000
redis_git_dirty:0
redis_build_id:7897e7d0e13773f
redis_mode:standalone
os:Linux 3.10.0-957.el7.x86_64 x86_64
......
退出数据库
| exit |
10.0.0.241:6379> exit
[root@es01 /data/redis/conf]#
5.安装Logstash
操作步骤同本文"三-2章节相同"
该架构下,Logstash不再安装在业务节点上,而是由管理节点承载Logstash服务
step1 修改配置文件
|
vim /etc/logstash/logstash.yml path.data: 路径 #指定服务数据存放路径(默认:/var/lib/logstash) http.host: "IP地址" #指定监听地址 http.port: 端口 #指定服务端口(默认端口:9600) path.logs: 路径 #指定服务日志存放路径(默认:/var/log/logstash) |
[root@es01 /tmp]# egrep -v '^$|^#' /etc/logstash/logstash.yml
path.data: /data/logstash/data
http.host: "10.0.0.241"
http.port: 9600
path.logs: /data/logstash/logs
[root@es01 /tmp]# mkdir /data/logstash/{data,logs} -p
[root@es01 /tmp]# chown -R logstash. /data/logstash
[root@es01 /tmp]# ll /data/logstash
total 0
drwxr-xr-x 2 logstash logstash 6 Dec  8 18:27 data
drwxr-xr-x 2 logstash logstash 6 Dec  8 18:27 logs
step2 指定日志来源
|
vim /etc/logstash/conf.d/redis_input.conf input{ redis {
host =>"Redis主机地址"
port => "Redis服务端口" #默认服务端口为6379
db => "数据库ID" #需与业务端filebeat服务配置文件中的数据库ID对应
data_type => "list"
key => "日志类型" #需与业务端filebeat服务配置文件中的key值对应
}
} `output{ stdout { codec => rubydebug }
elasticsearch{
hosts => ["日志服务器IP地址:端口号"]
index => "日志存储库名称"
}
} |
[root@es01 /tmp]# cd /etc/logstash/conf.d/
[root@es01 /etc/logstash/conf.d]# cat redis_input.conf
input {
    redis {
        host => "10.0.0.241"
        port => "6379"
        db => "0"
        data_type => "list"
        key => "nginx_json_log"
    }
}
output {
    stdout { codec => rubydebug }
    elasticsearch{
        hosts => ["10.0.0.241:9200"]
    index => "nginx-redis-%{+YYYY.MM.dd}"
    }
}
step3 启动logstash
| systemctl start logstash |
[root@es01 /etc/logstash/conf.d]# systemctl start logstash
[root@es01 /etc/logstash/conf.d]# ss -lnt | grep 9600
LISTEN 0 50 ::ffff:10.0.0.241:9600 :::* 